 Operations Hub
Visualization
A visualization widget is a graph with additional features. The following features are available in a visualization widget:
- Line chart
- Area chart
- Bar chart
- Stacked bar chart
- Donut chart
- Multiple charts
- Additional y-axis
- Zooming in or out
- Grid lines
- Rotation
- Support of negative values
- Improved look and feel of tooltips
- Ability to focus on a specific field on the chart
- Grouping using a query field
Important: Due to the format of the data returned by Historian REST calls, the Visualization widget cannot display data from Historian sources.
Visualization Settings
When you use a visualization widget, in addition to the default settings of a widget, the following settings are available.
| Setting | Description |
|---|---|
| Flow | Select the query (from the ones added in the PAGE DATA section) that should be used to retrieve information in the graph. |
| Switch Row/Column | Select this check box if you want to switch the x-axis and y-axis data. |
| X-axis | Provide values in the following boxes for x-axis settings:
|
| Y-axis | Provides values in the following boxes for y-axis settings:
|
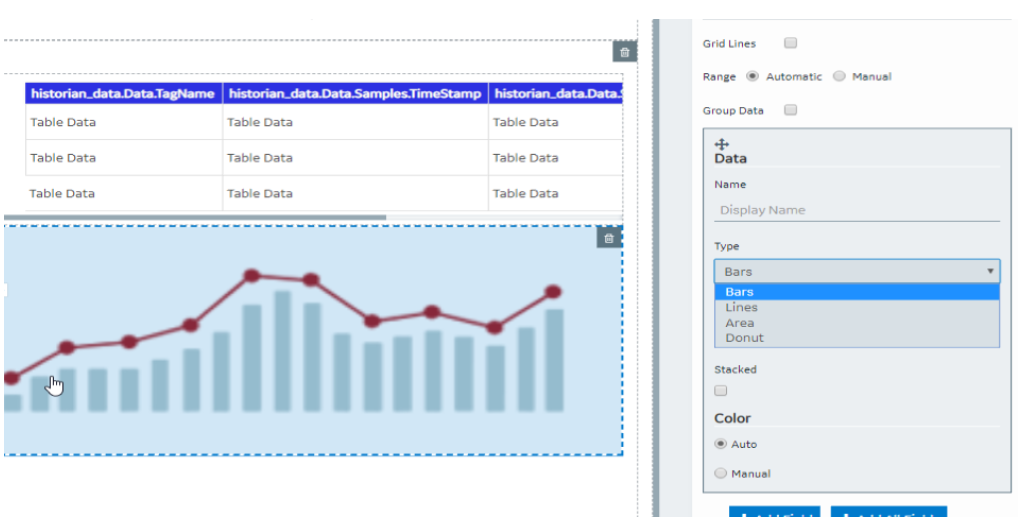
| Data | Provide values in the following boxes for the data settings:
|
| Add Field | Select this button if you want to plot another field on the graph. |
| Add All Fields | Select this button if you want to plot all the entity fields. |
Using a Visualization Widget
Suppose you want to plot the following information on a graph:
- Sales amount for two branches - Tokyo and Tel Aviv, plotted as a line chart and an area chart, respectively.
- Sales amount for two products - V26 and V27, plotted as a stacked bar chart.
- Breakdown of sales amount per branch - plotted as a donut chart.
- Create an entity to store the sales amount for the two branches and the two products.
- Create a Get query to retrieve the sales amount.
- In the page designer, in the PAGE DATA section of the container, add the query.
- Add two visualization widgets to the container.
- Add the following headers for the visualization widgets:
- Lines/Area and Stacked
- Donut
- For the Lines/Area and Stacked chart, provide values as described in the following table for the x-axis.
Setting Description Flow Select the query that you have created. Data Select the daily field of the query. Rotate Ticks Select the check box. Grid Lines Select the check box. - Select Add Field.
An additional Data section appears for the other y-axis.
- Provide values as specified in the following table for the two y-axes.
Setting Description for the First Y-Axis Description for the Second Y-Axis Label Enter Amount. Enter Product. Grid Lines Select the check box. Not applicable Type Select Lines. Select Area. Data Select the field that stores the sales amount for the Tokyo branch. Select the field that stores the sales amount for the Tel Aviv branch. Y-axis side Select Left. Select Left. - Select Add Field twice. Two additional Data sections appear for the two y-axes.
- Provide values as specified in the following table for the two y-axes.
Setting Description for the First Y-Axis Description for the Second Y-Axis Type Select Bars. Select Bars. Data Select the field that stores the sales amount for the product V27. Select the field that stores the sales amount for the product V26. Stacked Select the check box. Select the check box. Y-axis side Select Right. Select Right. - For the Donut chart, select Add Field twice, and provide values as specified in the following table.
Setting Description Flow Select the query that you have created. Donut Title Enter Breakdown Per Branch. Type Select Donut for both the boxes. Data Select the field that stores the sales amount for V26 and V27, respectively. - Save the application, and preview it. The first graph displays a line chart and an area chart for the sales amount of Tokyo and Tel Aviv, respectively. It also displays a stacked bar chart for the sales amount of the two products, V26 and V27. The second graph displays a donut chart for the sales amount of V26 and V27.