 Operations Hub
Big Data
The bid data widget is a visualization widget that supports big data. Compared to the visualization widget, the big data widget allows you to specify the range more accurately.
Note: You cannot plot a donut chart or change the format of a date-time variable on x-axis for a big data widget.
Important: Due to the format of the data returned by Historian REST calls, the Big Data widget cannot display data from Historian sources.
Big Data Settings
When you use a big data widget, in addition to the default settings of a widget, the following settings are available.
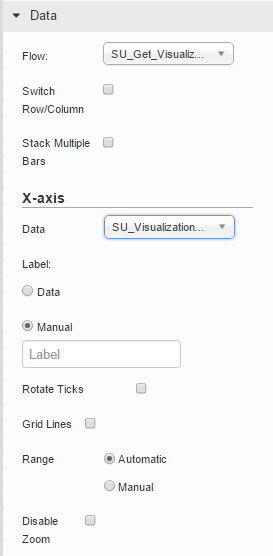
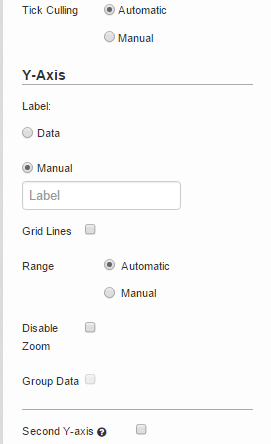
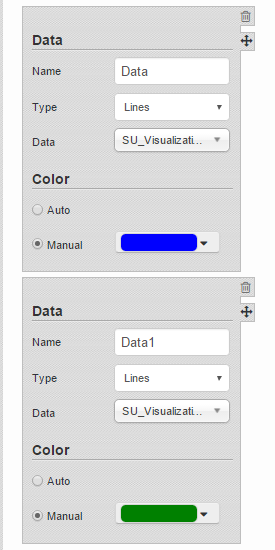
For instructions on configuring these settings, refer to Visualization.
About Zooming In and Zooming Out
Since the data displayed using a big data widget is huge, you can zoom in a selected area on the graph. To do so, you must specify the area precisely by dragging the mouse pointer on the area.
You can drag the mouse pointer in horizontal, vertical, or diagonal directions.
- If you drag the mouse pointer in a horizontal direction, the zoom-in area is set for only the x-axis.
- If you drag the mouse pointer in a vertical direction, the zoom-in area is set for only the y-axis.
- If you drag the mouse pointer in a diagonal direction, the zoom-in area is set for both x-axis and y-axis.
You can perform the following actions to zoom in or zoom out the widget:
- Zoom in a selected area by selecting
 .
. - Pan across the widget by selecting
 .
. - Zoom in from the center of the widget by selecting
 .
. - Zoom out from the center of the widget by selecting
 .
. - View the complete range of the graph by selecting
 .
. - Reset the zoom level by selecting
 .
.


