About the Statistical Analysis of Autolog Variables
You can statistically analyze the value you enter for autolog variables in the Quartile view or Whisker chart that appear in the page displaying the autolog sheet.
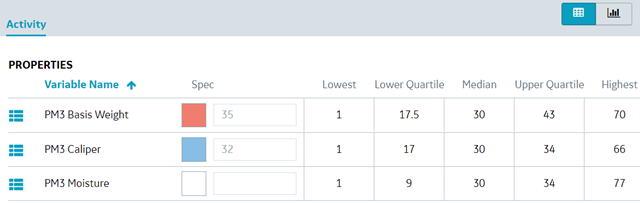
The Quartile view is an indicator of the range of values you can enter for a variable.
To access the Quartile view, in the page displaying the autolog sheet, select .
You can view the value for the following statistical items for a variable:
Lowest
Lower Quartile
Median
Upper Quartile
Highest
Note: The values for these statistical items are calculated based on the value entered for the variable in the last 20 completed activities associated with the same event. If no historical data exists for a variable, the value for these statistical items associated with the variable appear blank.
The following image illustrates a Quartile view for variables associated with an activity.
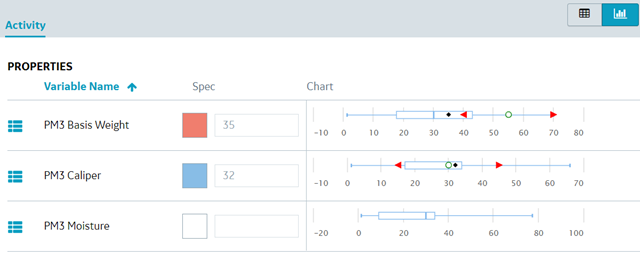
Access the Whisker Chart
The Whisker chart is a visual representation of the range of values for statistical items associated with the variable. To access the Whisker chart, in the page displaying the autolog sheet, select .
The following table describes statistical items and the icon associated with each item that appears in the Whisker chart.
Tip: You can hover an icon to view the value of each statistical item.
Statistical Item
Icon
Represents the Lower Quartile point at left and the Upper Quartile point at right with median represented by a vertical line.
Represents the Upper Reject limit beyond which the variable value is rejected.
Represents the Lower Reject limit below which the variable value is rejected.
Represents the Target value for the variable.
Represents the Actual value you entered for the variable.
Note: The Lower, Median, and Upper Quartile points are calculated based on the values entered for the variable in the last 20 completed activities associated with the same event. If no historical data exists for a variable, the values for these items appear blank. The values for Upper and Lower Reject limits are based on the Plant Applications Administrator configurations.
The following image illustrates a Whisker chart for variables associated with an activity.
Access the Specification Limits
Based on the value you enter for a variable in the page displaying the autolog sheet, the Spec column indicates whether the value is within the acceptable specification limits. The following table describes the color used to denote the specification limits.
Color
Description
White
No value is entered for the variable
Blue
The value entered for the variable is within the Upper and Lower User limits, or the Target value.
Green
The value entered for the variable is within the Upper and Lower Warning limits, and below or beyond the Upper and Lower User limits, respectively.
Yellow
The value entered for the variable is within the Upper and Lower Reject limits, and below or beyond the Upper and Lower Warning limits, respectively.
Red
The value entered for the variable is below or beyond the Upper and Lower Reject limits, respectively.
 .
. 
 .
.