Reports

About Reports

As a supervisor, you can generate OEE and production status reports for selected assets, displayed as a series of cards.

The Reports application enables you to generate OEE and production status reports for selected assets, displayed as a series of cards. You can access the KPI reports and production status of the plant by Department, Production Line, and Production Unit. The application also provides information about Planned vs. Actuals for each KPI.

The OEE reports track production conditions and events that contribute to manufacturing inefficiencies related to downtime, waste, and production throughput. The application automatically tracks OEE by product and order.
Note: To access information about a Production Unit in the Reports application, you must specify the Production Rate Specification attribute for the Production Unit in the Plant Applications Administrator. Else, a message indicating the non-availability of data for the corresponding unit appears in the Reports application. For more information, refer to the OEE: Production Metrics topic in the Proficy Plant Applications Help.

OEE is derived as a product of the following metrics:

OEE = Availability x Performance x Quality
Note: For information about the calculation of OEE parameters for time-based units, refer to the OEE Parameters Calculation for Time-Based Units topic.

When reporting OEE statistics, the following thresholds apply:

Good> 85 percent
Moderate> 50 percent and <= 85 percent
Low<= 50 percent
Note: The maximum value for the KPIs are set to 100% by default. However, you can override this by setting OEE Max Limit Override to true. The OEE Max Limit Override flag allows the OEE cap beyond 100%. When this flag is set to false and the KPI actual value is more than 100%, the value is defaulted to 100% in the chart.

The production status report provides data related to tracking of products and order-completion status (scheduled for production, in progress, or completed).

In the Reports application, in the Show list, you can select one of the following options to generate the corresponding report type:

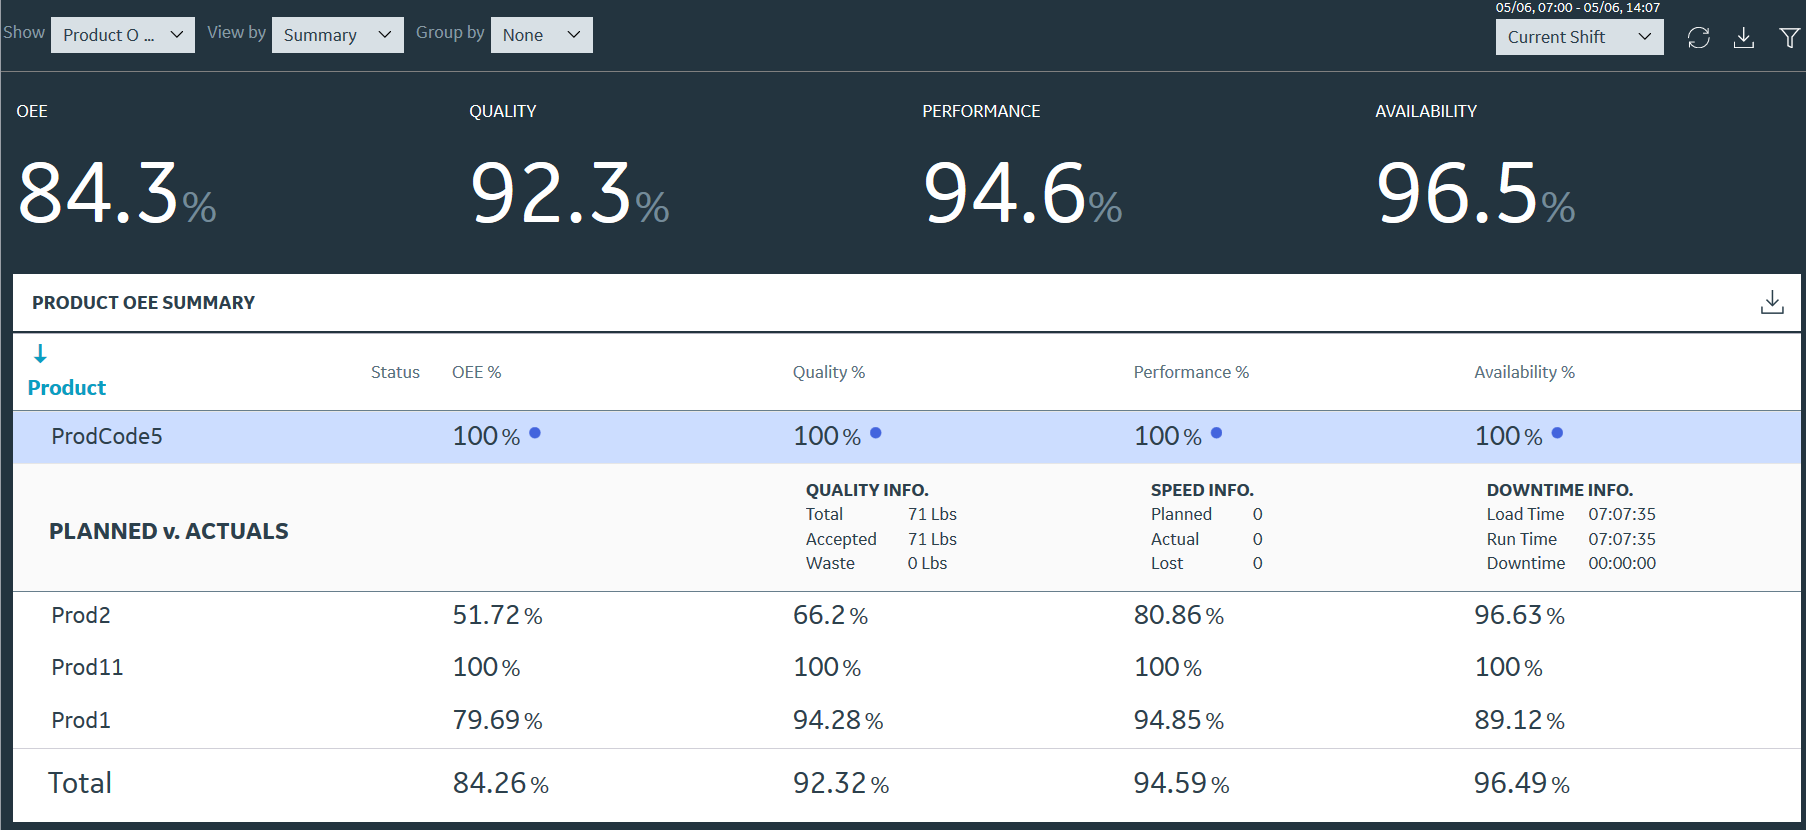
  • Product OEE: Displays the OEE report for a product. You can expand a row in the search results to compare planned versus actual KPI data for the product as shown in the following image.
    Figure: Product OEE Report
  • Order OEE: Displays the OEE report for an order. You can expand a row in the search results to compare planned versus actual KPI data for the order as shown in the following image.
    Figure: Order OEE Report
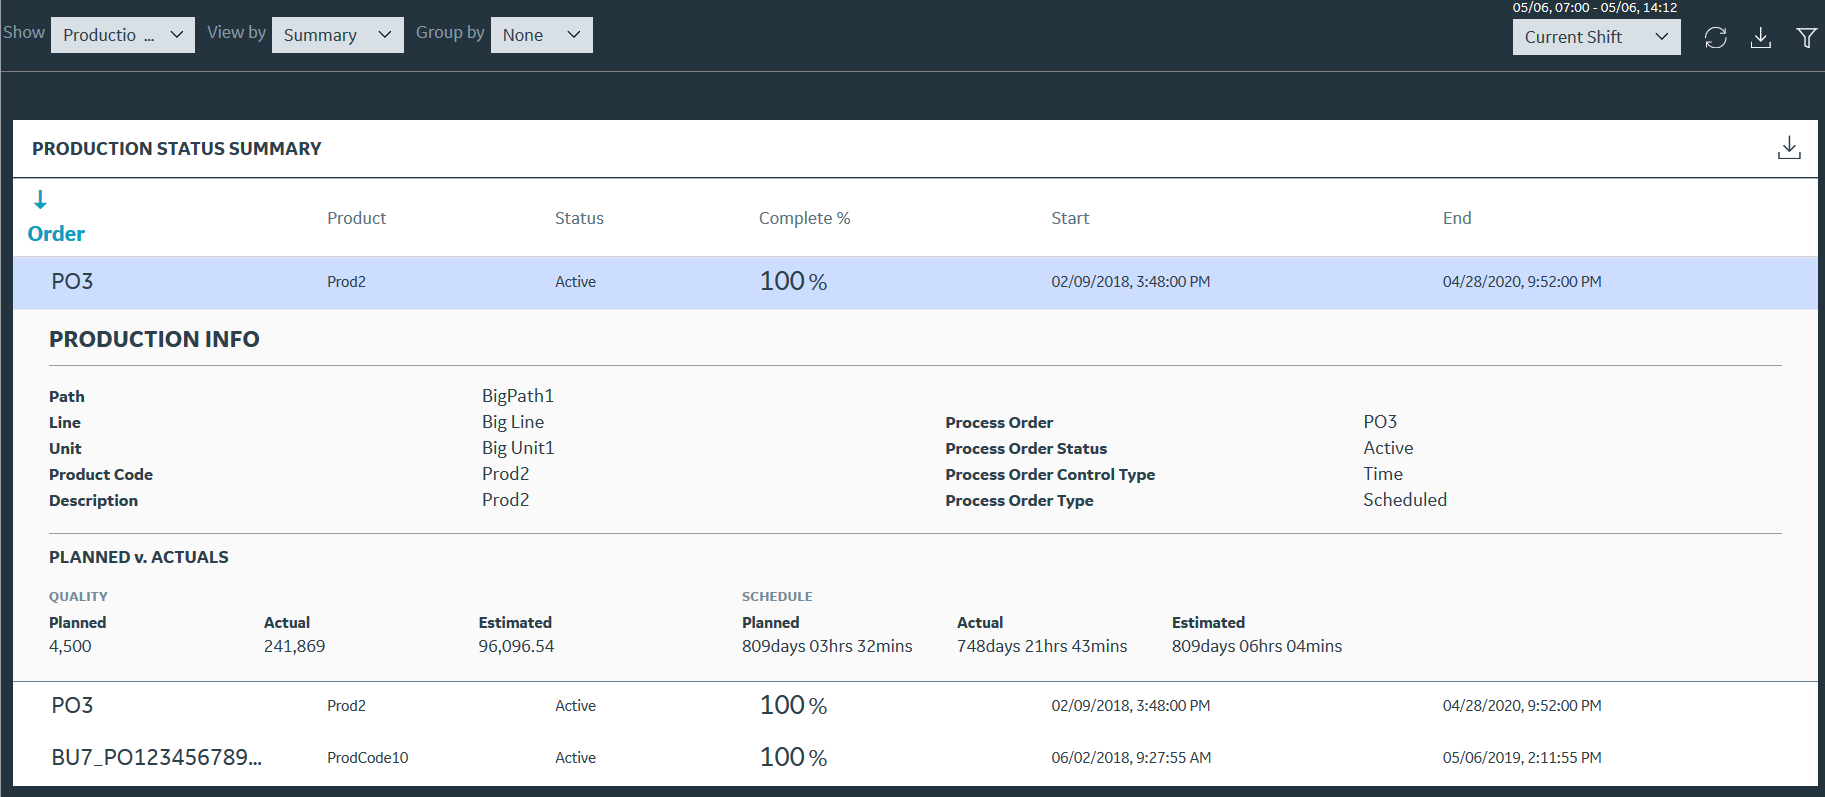
  • Production Status: Displays the status of an order in a shift. You can expand a row in the search results to access more information about the order as shown in the following image.
    Figure: Production Status Report
Tip:

You can select , select the NPT check box, and then select Apply to include any non-productive time (NPT) in these reports. For more information, refer to the About Non-Productive Time in Downtime Calculations topic.

OEE Parameters Calculation for Production Lines

To calculate an OEE parameter (Availability, Performance, or Quality) value for a Production Line, the corresponding OEE parameter for each Production Unit within the Production Line are summed up based on the OEE mode selected for the Production Unit. For more information, refer to the following topics:
Note: These KPI metrics are based on the OEE Aggregation Store setting. If OEE Aggregation Store is set to False, the values are calculated on the fly every time the chart is opened or refreshed. If it is set to True, the values are populated from the OEE Aggregation tables. For more information, refer to the About OEE Aggregation Store topic.

OEE Parameters Calculation for Standard Units

The classic OEE mode approach to the OEE calculation for standard units measures the performance and quality losses in terms of loss of production availability or productivity that are attributed to the performance and quality, respectively.

The classic OEE modes are Standard, None, Long Running 840D, and Long Running EDM are defined for a Production Unit in the Plant Applications Administrator. The OEE calculation formula for all these modes are same.

The OEE parameters Availability, Performance, and Quality for the standard Production Units are calculated based on the formula described in the following table.
OEE ParameterCalculation Formula
AvailabilityAvailability = Net availability run time/Planned production time

Where, Net availability run time = Planned production time - Availability downtime

PerformancePerformance = Actual production/Target production
Where,
  • Actual production is the actual productivity of the Unit
  • Target production is the potential productivity of the Unit
QualityQuality = Net production/Actual production
Where,
  • Net production = Actual production - Waste
  • Actual production is the actual productivity of the Unit
  • Waste is the amount of rejected products

Classic-Mode OEE Parameters Calculation

In this example, the value for each OEE parameter per day for a bottle manufacturing plant is as shown in the following table.
InputsValue
Planned production time24 hr
Availability downtime1 hr
Actual production900 bottles
Target production1000 bottles
Waste100 bottles
The following table provides the value of each OEE parameter calculated based on the formula described in the earlier section.
OEE parameterParameter valueFormula usedExplanation
Availability23/24 = 0.125Availability = Net availability run time/Planned production time.Planned production time = 24 hr

Availability downtime = 1 hr

Net availability run time = 24 - 1 = 23 hr

Performance900/1000 = 0.9Performance = Actual production/Target productionActual production = 900 bottles

Target production = 1000 bottles

Quality800/900 = 0.8889Quality = Net production/Actual productionActual production = 900 bottles

Waste = 100 bottles

Net production = 900 - 100 = 800 bottles

OEE Parameters Calculation for Time-Based Units

The time-based approach to the OEE calculation measures the performance and quality losses in terms of loss of production time or downtimes that are attributed to the performance and quality, respectively.

The OEE parameters Availability, Performance, and Quality for the time-based units are calculated based on the formula described in the following table.
OEE ParameterCalculation Formula
AvailabilityAvailability = Net availability run time/Planned production time

Where, Net availability run time = Planned production time - Availability downtime

PerformancePerformance = Net performance run time/Net production time
Where,
  • Net production time = Planned production time - Availability downtime
  • Net performance run time = Net production time - Performance downtime
QualityQuality = Net quality run time/Net production time
Where,
  • Net production time = Planned production time - Availability downtime - Performance downtime
  • Net quality run time = Net production time - Quality downtime

Time-Based OEE Parameters Calculation

In this example, the value for the production time and downtime for each OEE parameter is as shown in the following table.
InputsValue
Planned production time60 minutes
Availability downtime10 minutes
Performance downtime10 minutes
Quality downtime10 minutes
The following table provides the value of each OEE parameter calculated based on the formula described in the earlier section.
OEE parameterParameter valueFormula usedExplanation
Availability50/60 = 0.8333Availability = Net availability run time/Planned production time.Planned production time = 60 minutes

Availability downtime = 10 minutes

Net availability run time = 60 - 10 = 50 minutes

Performance40/50 = 0.8Performance = Net performance run time/Net production timePlanned production time = 60 minutes

Availability downtime = 10 minutes

Performance downtime = 10 minutes

Net performance run time = 50 - 10 = 40 minutes

Net production time = 60 - 10 = 50

Quality30/40 = 0.75Quality = Net quality run time/Net production timePlanned production time = 60 minutes

Availability downtime = 10 minutes

Performance downtime = 10 minutes

Quality downtime = 10 minutes

Net quality run time = 50 - 10 = 40 minutes

Net production time = 60 - 10 - 10 = 40 minutes

Viewing Reports

You can view the Reports summary for Product OEE, Order OEE, and Production status as a series of cards based on selected assets.

Procedure

  1. On the Reports screen, select an option from the Show drop-down list.
    • Product OEE
    • Order OEE
    • Production Status
    Show determines the data to be displayed on the cards, such as OEE data or Production Status tracking data.
  2. Select one of the following from the View by drop-down list:
    • Summary (Default option)
    • Department
    • Line
    • Unit
    View by determines the physical assets upon which the display is based, such as Departments, Lines, and Units, with an additional summary view.
  3. You can group the information as per your requirement
    View by optionGrouping options
    Summary (default option) or DepartmentGroup by drop-down-list contains the following options:
    • None (default option)
    • Shift
    • Crew
    LineIn drop-down list contains a full list of department names. Example:
    • Department 1
    • Department 2
    • Department 3
    You can also group results by none, shift, or crew.
    UnitIn drop-down list contains a full list of line names. Example:
    • Line 1
    • Line 2
    • Line 3

    You can also group results by none, shift, crew, or path.

  4. Select the required time range and click the refresh button next to the drop-down to view and update the results.
    • Current Shift (Default)
    • Last Shift
    • Today
    • Yesterday
    • Current week
    • Last week
    • Custom
    • Tomorrow (for Production Status only)
    • Next Week (for Production Status only)
    • Next Shift (for Production Status only)
    The time range that you select will be displayed in the form of date and time next to the time-interval drop-down list. The Reports screen generates the report for the selected options. For example, if you select Product OEE by Line in department 1 grouped by Shift for the current shift, the application generates a list with the following information:
    • A summary of KPIs is displayed at the top: OEE, Quality, Performance, and Availability
      Note: The KPI values are based on the selected time range and not on the Product or Order time durations.
    • For each line, grouped by shift, following columns are displayed:
      • Product – Products produced on the Machine or Machine group. If the report selected is Product OEE, this column shows the Product information. If the report selected is Order OEE, this column shows the Order information.
      • Status – When an OEE exceeds an established threshold, the Status column displays a red dot.
      • Separate columns display each KPI for the listed products: OEE %, Performance %, Availability %, and Quality %.
      • The last row for each shift displays the Total value rolled up for each KPI card.
    If you select Production Status in the Show drop-down list, you see the production status report for the model context selected through View By and In drop-down list and grouped by the Group by category. The report view includes the following information:
    • Order (sortable) – The list of Orders in the Machine or Machine Group, or as a Summary, as per the orders configured in the Plant during the time range selection made.
    • Product – Name of the Product associated with the Order in the row.
    • Status – the status of the Order (for example: Completed, Active, Pending).
    • Complete % – completion percentage at the time the Report is displayed.
    • Start – start time of the Order. If the Order has already started or completed, this time shows the actual time, else it displays the planned time.
    • End – End time of the Order. If the Order is already completed, this time shows the actual time, else it displays the planned time. If the order is in process, it displays the estimated time.
    • In-line View – If you select a row, an in-line view opens, displaying Production Information along with the Planned vs. Actual values of Quality and Schedule.
  5. Optional: Click a row to see the color chips for all the three KPIs. The colors of these chips indicate the ranges of the KPI values which are static and are not based on Product or plant model context.
  6. Optional: Click a row to see the details of the KPIs of that particular row.
    The row expands to display Planned vs. Actual raw values of the KPIs for the corresponding row.
  7. Optional: For any combination of the Options selected, once the data is retrieved and displayed they can be exported to a csv file by clicking the export icon on the right top corner of the cards.