Downtime Displays

Use the Downtime Displays app to access the downtime overview and downtime events list for the equipment assigned to you. You can also view the list of KPIs and add non-productive time events and downtime events for the machines assigned to you. Learn more…

About Downtime Displays

As an operator, you can use the Downtime Displays application in the Plant Applications Universal Client enables you to access the downtime overview and downtime events list for the equipment assigned to you.

You can access the following pages in the Downtime Displays application:

About Non-Productive Time in Downtime Calculations

When accessing the KPIs in Downtime Displays, Equipment, and Reports, you can include or exclude non-productive time (NPT) in the downtime calculation of KPIs.

The following sections describe various scenarios of downtime calculations.

Scenario 1: Downtime Duration is Within NPT Duration

The following table describes the scenario when the NPT event starts before the start time of the downtime event and ends after the end time of the downtime event. The table further includes the downtime calculation in this scenario.
Time Entry TypeStart Time (mm/dd/yy hh: mm)End Time (mm/dd/yy hh: mm)Duration (mins)Downtime Calculation (mins)
Include NPTExclude NPT
Downtime5/10/18 5:085/10/18 5:10202
NPT5/10/18 5:055/10/18 5:1510
The downtime duration is calculated as follows:
  • When NPT is included: The downtime duration is ignored by the application. In this scenario, the downtime duration appears as 0 mins.
  • When NPT is excluded: The actual downtime duration appears. In this scenario, the downtime duration appears as 2 mins.

Scenario 2: Downtime Starts Before NPT Starts and Ends Before NPT Ends

The following table describes the scenario when the downtime event starts after the start time of the NPT event and ends before the end time of the NPT event. The table further includes the downtime calculation in this scenario.
Time Entry TypeStart Time (mm/dd/yy hh: mm)End Time (mm/dd/yy hh: mm)Duration (mins)Downtime Calculation (mins)
Include NPTExclude NPT
Downtime5/10/18 5:175/10/18 5:25838
NPT5/10/18 5:205/10/18 5:3010
The downtime is calculated as follows:
  • When NPT is included: Only the downtime duration before the NPT event starts appears as the downtime duration. In this scenario, the downtime duration appears as 3 mins.
  • When NPT is excluded: The actual downtime duration appears. In this scenario, the downtime duration appears as 8 mins.

Scenario 3: Downtime Starts and Ends After NPT Starts and Ends

The following table describes the scenario when the downtime event starts after the start time of the NPT event and ends after the end time of the NPT event. The table further includes the downtime calculation in this scenario.
Time Entry TypeStart Time (mm/dd/yy hh: mm)End Time (mm/dd/yy hh: mm)Duration (mins)Downtime Calculation (mins)
Include NPTExclude NPT
Downtime5/10/18 5:475/10/18 5:52525
NPT5/10/18 5:405/10/18 5:5010
The downtime is calculated as follows:
  • When NPT is included: Only the downtime duration after the NPT event ends appears as the downtime duration. In this scenario, the downtime duration appears as 2 mins.
  • When NPT is excluded: The actual downtime duration appears. In this scenario, the downtime duration appears as 5 mins.

Scenario 4: Downtime Starts Before NPT Starts and Ends After NPT Ends

The following table describes the scenario when the downtime event starts before the start time of the NPT event and ends after the end time of the NPT event. The table further includes the downtime calculation in this scenario.
Time Entry TypeStart Time (mm/dd/yy hh: mm)End Time (mm/dd/yy hh: mm)Duration (mins)Downtime Calculation (mins)
Include NPTExclude NPT
Downtime5/10/18 5:345/10/18 5:41727
NPT5/10/18 5:355/10/18 5:405
The downtime is calculated as follows:
  • When NPT is included: The sum of downtime durations before the NPT event starts and after the NPT event ends appears as the downtime duration. In this scenario, the downtime duration appears as 2 mins.
  • When NPT is excluded: The actual downtime duration appears. In this scenario, the downtime duration appears as 7 mins.

Access KPIs

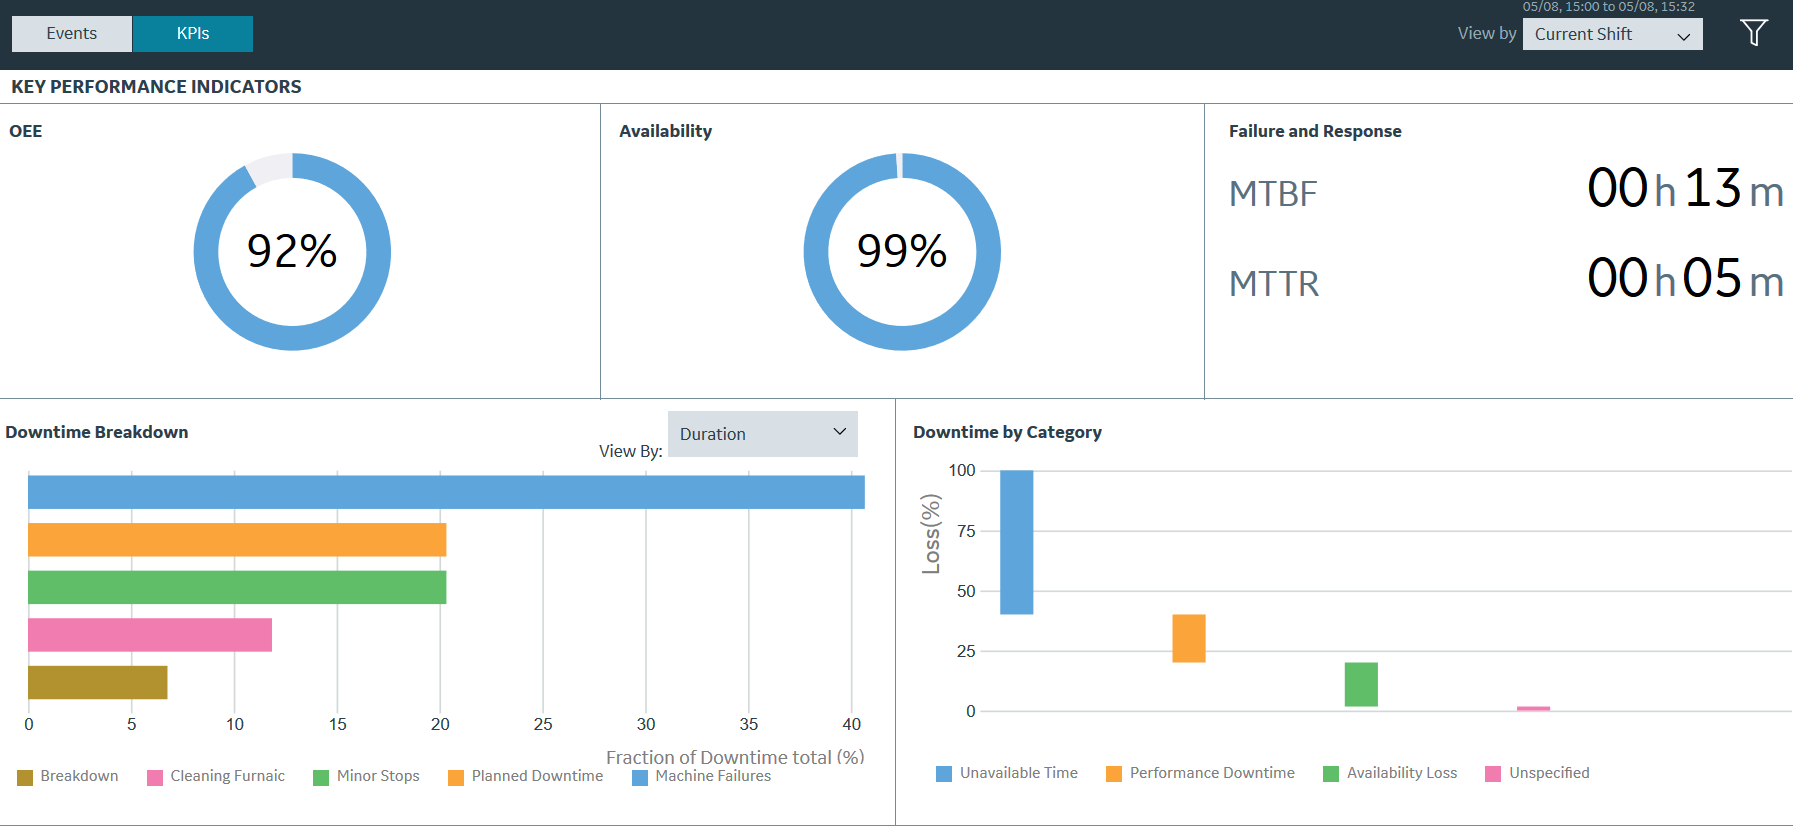
The Downtime Displays application enables you to access key performance indicators (KPIs) and a summary of downtime events for the equipment assigned to you. In the KPIs page, you can review the overall equipment effectiveness (OEE), availability, mean time between failures (MTBF), and mean time to repair (MTTR) values. You can use the charts for Downtime Breakdown and Downtime by Category to review the durations of different downtime events and their reasons.

Procedure

  1. Log in to the Plant Applications Universal Client.
  2. Select .
    The Events page appears.
  3. Select the KPIs tab.
    The Donut chart appears in the dashboard summarizing the OEE and availability of the equipment. Each KPI shows the following status information.
    StatusColorsRange
    GoodBlue> 85 percent
    ModerateYellow> 50 percent and <= 85 percent
    LowRed<= 50 percent
    Note: The maximum value for the KPIs are set to 100% by default. However, you can override this by setting OEE Max Limit Override to true. The OEE Max Limit Override flag allows the OEE cap beyond 100%. When this flag is set to false and the KPI actual value is more than 100%, the value is defaulted to 100% in the chart.

    The time duration for MTBF and MTTR values appears in hours and minutes.

    Note: These KPI metrics are based on the OEE Aggregation Store setting. If OEE Aggregation Store is set to False, the values are calculated on the fly every time the chart is opened or refreshed. If it is set to True, the values are populated from the OEE Aggregation tables. For more information, refer to the OEE Aggregation Store topic.
  4. In the drop-down list box containing the time range options, select a time range as described in the following table.
    Time RangeDescription
    Previous DaySelect to access all KPIs from the day prior to the current Production Day.
    Current DaySelect to access all KPIs from the start time of the current Production Day until the current time. If there are no shifts configured for the plant, this option is selected by default.
    Current ShiftSelect to access all KPIs from the start time of the ongoing shift until the current time. If shifts are configured for the plant, this option is selected by default.
    Previous ShiftSelect to access all KPIs from the shift prior to the current shift.
    Last 7 daysSelect to access all KPIs within seven days prior to the current Production Day.
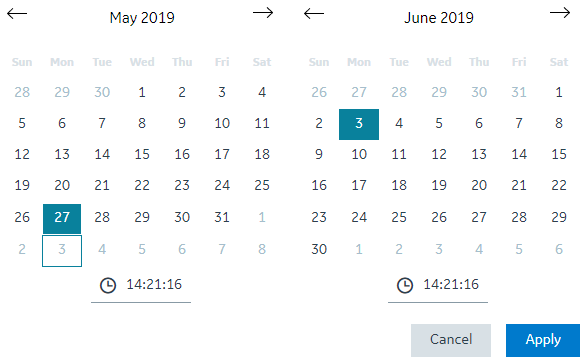
    CustomSelect to access all KPIs within a date and time range that you specify by using a calendar window.

    The following calendar window appears when you select the Custom option.

    To specify a custom date and time range in the calendar window:
    1. In the START DATETIME section, select a date and enter a time in the format hh:mm:ss.
    2. In the END DATETIME section, select a date and enter a time in the format hh:mm:ss.
    3. Select Apply.
  5. Optional: Select , then select the NPT check box, and then select Apply to include any non-productive time (NPT) in the results. For more information, refer to the About Non-Productive Time in Downtime Calculations topic.
  6. In the Downtime Breakdown section, in the View By box, select Duration or Count to access downtime events.
    You can access the loss percentage and reasons for the downtime events in the Downtime by Category chart.

Access a Downtime Events List

About This Task

You can access the list of downtime events for the selected time range to review the status and details for the downtime events.

Procedure

  1. Log in to the Plant Applications Universal Client.
  2. Select .
    The Events page appears, displaying a list of downtime events and their details in a tabular format. In the table displaying the list of downtime events and their details, you can resize a column or drag and drop a column to a new position. The column settings you select in the table are retained when you access the Events page later.
    A summary of unplanned, planned, external, and NPT downtime events within a time range appears in the page. In addition, the following information appears in a tabular format for each downtime event.
    ColumnDescription
    DT StatusThe downtime status for a downtime event along with the corresponding color.
    • Green: Active
    • Blue: Open
    • Black: Complete
    Note: The color scheme is based on the default color scheme setting in the Plant Applications Administrator.
    CategoryThe downtime category for a downtime event.
    LocationThe location of an equipment experiencing downtime.
    Start TimeThe start time for the downtime event.
    DurationThe downtime duration for the downtime event.
    Note: The value in this field is blank for open downtime events.
    ReasonThe downtime reason for the downtime event.
    ActionsThe actions that you can perform on a downtime event. You can select one of the following action items:
    Note: You can filter the downtime events based on filters applied to the selected columns. Select appearing next to the column name and then select required filters from the menu to include in the list. You also can drag a column to the column header to group the downtime events based on the column selected.
    Tip: The downtime events are listed in multiple pages. One page contains maximum of seven downtime events. If you access a different page in the downtime events list, you can select TOP to return to the first page.
  3. In the drop-down list box containing the time range options, select a time range as described in the following table. The range that you select appears in the form of date and time interval next to the drop-down list box containing the time range options.
    Time RangeDescription
    Previous DaySelect to access all downtime events from the day prior to the current Production Day.
    Current DaySelect to access all downtime events from the start time of the current Production Day until the current time. If there are no shifts configured for the plant, this option is selected by default.
    Current ShiftSelect to access all downtime events from the start time of the ongoing shift until the current time. If shifts are configured for the plant, this option is selected by default.
    Previous ShiftSelect to access all downtime events from the shift prior to the current shift.
    Last 7 daysSelect to access all downtime events within seven days prior to the current Production Day.
    Custom Select to access all downtime events within a date and time range that you specify by using a calendar window.

    The following calendar window appears when you select the Custom option.

    To specify a custom date and time range in the calendar window:
    1. In the START DATETIME section, select a date and enter a time in the format hh:mm:ss
    2. In the END DATETIME section, select a date and enter a time in the format hh:mm:ss
    3. Select Apply.
    Note: The shift values for current and previous shifts are determined by the settings selected in the Plant Applications Department level. The time-interval that you select appears in the form of date and time next to the time-interval drop-down list box.
  4. Optional: Select a downtime event to access the Quick Edit page and perform the following tasks:
    1. In the FAULT CODE section, select the box for the Fault Code, and then select a Fault Code associated with the downtime event.
      Tip: Alternatively, within the FAULT CODE section, you can enter the text to search for and select a Fault Code.
    2. In the REASONS section, select Top <number> to access the Top <number> Reasons menu, and then select a reason associated with the Fault Code.
      The <number> represents a numeric value ranging from 0 to 5, indicating the top downtime reasons most frequently selected by the operator. You can configure reasons in the Plant Applications Administrator.
      Note: The values that appear in the L1, L2, L3, and L4 boxes for the levels of reasons are configured in the Plant Applications Administrator and are automatically populated, if available, based on the reason you select in the Top <number> Reasons menu.
    3. In the ADD COMMENTS section, select Click to add/edit comment.
      The Comment window appears.
    4. In the ADD COMMENT box, enter a comment for the changes you made, and select Add Comment.
    5. Select Save to apply your changes.
  5. Optional: In the table displaying the list of downtime events and their details, select an option to perform an action as described in the following table.
    OptionDescription
    Select to filter the downtime events based on the specified duration. You can also select the NPT check box, and then select Apply to include any non-productive time (NPT) in the results.
    Select to update the downtime events list with the latest information available for your equipment.
    Note:
    This icon is enabled only when there are updates to the downtime events list. Else, one of the following icon appears:
    • : Indicates that there are no updates to the downtime events list.

    • : Indicates that the RabbitMQ service is down.

    Select either to add a downtime event or add a non-productive time (NPT) downtime event.
    Select to merge downtime events for the equipment from the same location.
    Note: This icon is enabled only when you select for more than one downtime event in the table.
    Select to delete multiple downtime events.
    Note: This icon is enabled only when you select for more than one downtime event in the table.
    Select to add or remove columns from the table displaying the downtime events list. The added columns are retrieved when you access the Events page later.
    By default, the following columns appear in the specified order when you access the Events page:
    1. DT STATUS
    2. CATEGORY
    3. LOCATION
    4. START TIME
    5. DURATION
    6. REASON
    7. PRODUCT
    Tip: You can use the horizontal scroll bar in the table to drag the scroll box and access the data from all the added columns.
    Select to automatically update the downtime events based on the selected time duration. You can disable this, if you do not want to update only the newly added downtime events.

Add a Downtime Event

About This Task

You can add a downtime event for the equipment that you are authorized to access.

Procedure

  1. Log in to the Plant Applications Universal Client.
  2. Select .
    The Events page appears, displaying a list of downtime events and their details in a tabular format.
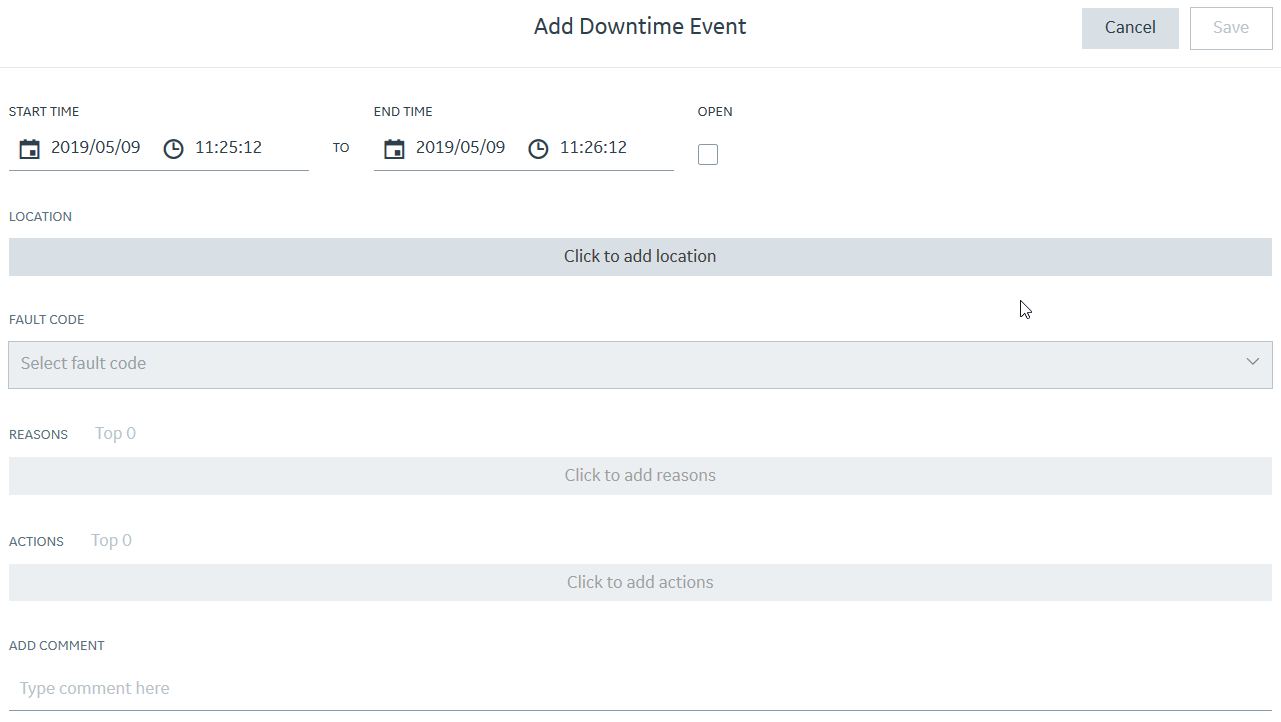
  3. In the Events page, select and then select Add Downtime Event from the menu to add a downtime event.
    The Add Downtime Event page appears.
  4. In the START TIME and END TIME box, enter a duration for the downtime event.
  5. In the LOCATION section, select Click to add location. The Select location windows appears. Select a department, line, and machine in the DEPARTMENT, LINE, and MACHINE sections, respectively, where you plan to add the downtime event. Select Apply.
    Tip: Alternatively, within the DEPARTMENT, LINE, and MACHINE sections, in the search box displaying , you can enter the text to search for and select the required item.
  6. In the FAULT CODE box, select a Fault Code to describe the downtime event.
    Tip: Alternatively, within the FAULT CODE box, enter the text to search for and select a Fault Code.
  7. In the REASONS section, select Top <number> to access the Top <number> Reasons menu, and then select a reason associated with the Fault Code.
    The <number> represents a numeric value ranging from 0 to 5, indicating the top downtime reasons most frequently selected by the operator. You can configure reasons in the Plant Applications Administrator.
    Note: The values that appear in the L1, L2, L3, and L4 boxes for the levels of reasons are configured in the Plant Applications Administrator and are automatically populated, if available, based on the reason you select in the Top <number> Reasons menu.
  8. In the ACTIONS section, select Top <number> to access the Top <number> Actions menu, and then select an action taken by the operator for the downtime event.
    The <number> represents a numeric value ranging from 0 to 5, indicating the top actions most frequently performed by the operator. You can configure actions in the Plant Applications Administrator.
    Note: The values that appear in the L1, L2, L3, and L4 boxes for the levels of actions are configured in the Plant Applications Administrator and are automatically populated, if available, based on the action you select in the Top <number> Actions menu.
  9. Optional: In the ADD COMMENT box, enter a comment for the downtime event.
  10. Select Save to add the downtime event for the selected machine.

Results

The newly added downtime event appears in the table displaying the list of downtime events and their details in the Events page.

Add an NPT Downtime Event

  1. Log in to the Plant Applications Universal Client.
  2. Select .
    The Events page appears, displaying a list of downtime events and their details in a tabular format.
  3. In the Events page, select and then select Add NPT to add a non-productive time (NPT) downtime event.
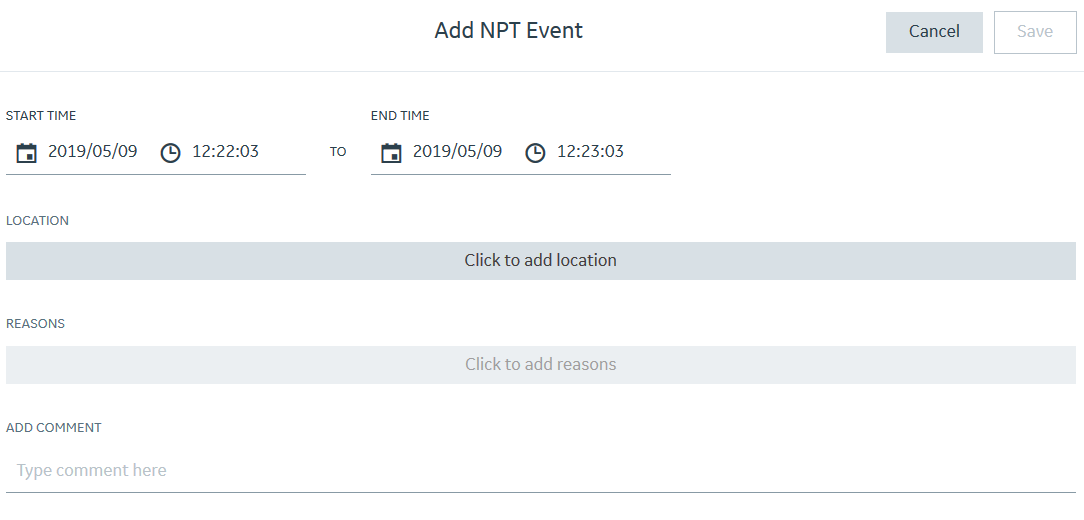
    The Add NPT Event page appears.
  4. In the START TIME and END TIME box, enter a duration for the NPT downtime event.
  5. In the LOCATION section, select Click to add location. The Select location window appears. Select a department, line, and machine in the DEPARTMENT, LINE, and MACHINE sections, respectively, where you plan to add the NPT downtime event. Select Apply.
    Tip: Alternatively, within the DEPARTMENT, LINE, and MACHINE boxes, in the search box displaying , you can enter the text to search for and select the required item.
  6. In the REASONS section, select Click to add reasons. The Select Reasons window appears. Select the levels of reasons from the available reasons and then select Apply.
    Note: The Click to add reasons is enabled only when you configure the reasons for the selected machines in the Plant Applications Administrator.
  7. Optional: In the ADD COMMENT section, in the box for the comment, enter a comment for the event.
  8. Select Save to add the NPT downtime event in the downtime events list.

Results

The newly added NPT downtime event appears in the table displaying the list of downtime events and their details in the Events page.

Modify Downtime Events

  1. Log in to the Plant Applications Universal Client.
  2. Select .
    The Events page appears.
  3. Access the required downtime events list.
  4. In the row containing the downtime event whose detail you want to modify, select .
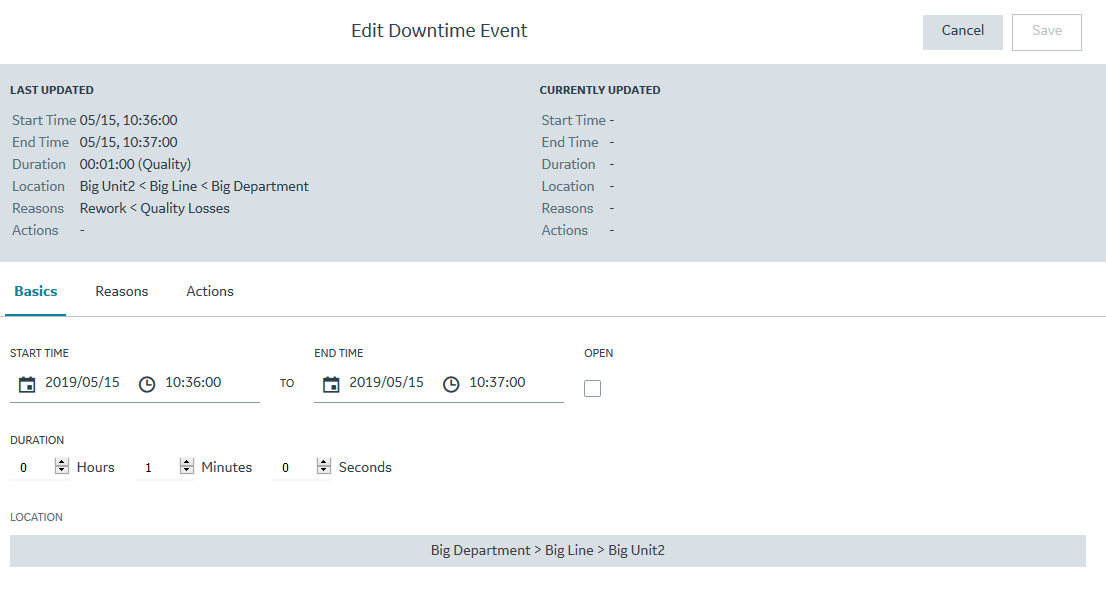
    The Edit Downtime Event page displaying the Basics section appears.
  5. In the Basics section, modify the duration, status, and machine for the downtime event.
    1. Enter a date and time in the Start time and End time boxes to update the duration of the downtime event.
      Note: The End time box is enabled only when the Open check box is cleared.
    2. Select the Open check box to mark the event status as open.
    3. In the LOCATION section, select an existing location. The Select location window appears. In the Machine section, select a machine to modify the machine selected initially for the downtime event and then select Apply.
    Tip: The modified downtime event details appear in the CURRENTLY UPDATED section.
  6. Select the Reasons tab, and then modify the Fault Code and reasons for the downtime event.
    1. In the FAULT CODE section, select the required Fault Code.
      Tip: Alternatively, within the FAULT CODE section, enter the text to search for and select a Fault Code.
    2. In the REASONS section, select reasons corresponding to the Fault Code for the downtime event.
      Note: Select Top <number> to access the Top <number> Reasons menu, and then modify the action taken by the operator for the downtime event. The <number> represents a numeric value ranging from 0 to 5, indicating the top downtime reasons most frequently selected by the operator. You can configure reasons in the Plant Applications Administrator.

      The values that appear in the L1, L2, L3, and L4 boxes for the levels of reasons are configured in the Plant Applications Administrator and are automatically populated, if available, based on the reason you select in the Top <number> Reasons menu.

    3. In the ADD/EDIT COMMENTS section, select Click to add/edit comment. The Comment window appears. In the ADD COMMENT box, enter a comment or modify the comment for the changes you made and select Add Comment
  7. Select the Actions tab, and then, in the ACTIONS section, modify the level of reasons for an event.
    Note: Select Top <number> to access the Top <number> Actions menu, and then modify the action taken by the operator for the downtime event. The <number> represents a numeric value ranging from 0 to 5, indicating the top actions most frequently performed by the operator. You can configure actions in the Plant Applications Administrator.

    The values that appear in the L1, L2, L3, and L4 boxes for the levels of actions are configured in the Plant Applications Administrator and are automatically populated, if available, based on the action you select in the Top <number> Actions menu.

    1. In the ADD/EDIT COMMENTS section, select Click to add/edit comment. The Comment window appears. In the ADD COMMENT box, enter a comment or modify the comment for the changes you made and select Add Comment
  8. Optional: Select the NPT tab, and then modify the event details for an NPT.
    1. In the End Time box, modify the duration for the non-productive time (NPT) downtime event.
    2. In the ADD/EDIT COMMENTS section, select Click to add/edit comment. The Comment window appears. In the ADD COMMENT box, enter a comment or modify the comments entered for the NPT downtime event and select Add Comment.
    Note: The NPT section appears based on the selected Fault Code and downtime reasons.
  9. Select Save to save the modified details of the downtime event.

Results

The modified details appear for the downtime event.

Copy Faults and Reasons to the Selected Downtime Event

  1. Log in to the Plant Applications Universal Client.
  2. Select .
    The Events page appears, displaying a list of downtime events and their details in a tabular format.
  3. Access the required downtime events list.
  4. In the table displaying the list of downtime events and their details, select for the target downtime events from which you want to copy the faults and reasons.
    Note: The selected downtime events must be associated with the equipment from the same location.
    The action for the deselected rows is enabled.
  5. Select for the source downtime event row from which you want to copy the faults and reasons.
  6. Select OK to confirm that you want to copy the faults and reasons for the selected downtime events.

Results

The target downtime events now have the same faults and reasons as the source downtime event.

Split a Downtime Event

About This Task

You can split an existing downtime event into multiple downtime events of equal or customized duration so that you can accommodate correct reasons to downtime events that happened during the overall downtime duration.

Procedure

  1. Log in to the Plant Applications Universal Client.
  2. Select .
    The Events page appears, displaying a list of downtime events and their details in a tabular format.
  3. Access the required downtime events list.
  4. Select corresponding to a downtime event to split the downtime event.
    The Split page appears.
  5. In the Split page, enter the number of target downtime events and the option to split the duration.
    1. In the SPLIT DURATIONS section, select one of the following options:
      • Equally: The total duration of the selected source downtime event is equally divided into the duration of target downtime events.
        Note: If you select this option, you cannot modify the duration for downtime events later.
      • Manually: The total duration of the selected source downtime event is manually divided into the duration of new target downtime events.
    2. In the Number of Events box, select a value corresponding to the downtime events into which you want to split the selected downtime event. Select Next.
      Note: You can split a downtime event into a minimum of two and a maximum of six further equal or customized duration downtime events.
    The Split Event page appears.
  6. In the Split Event page, enter the duration and downtime reason.
    1. In the Duration column for a downtime event, enter a valid duration in the boxes corresponding to the time format hh:mm:ss.
      Note: You can enter a duration for target downtime events only when you selected the option to manually enter the duration.
    2. In the Quick Pick column for a downtime event, you can select Top <number> to access the Top <number> Reasons menu, and then select a reason associated with a Fault Code.
      The <number> represents a numeric value ranging from 0 to 5, indicating the top downtime reasons most frequently selected by the operator. You can configure reasons in the Plant Applications Administrator.
      Note: The values that appear in the L1, L2, L3, and L4 boxes for the levels of reasons are configured in the Plant Applications Administrator and are automatically populated, if available, based on the reason you select in the Top <number> Reasons menu.
      Tip: Alternatively, you can select a downtime reason in the L1 box, and then select the associated reason levels, if available, in the L2, L3, and L4 boxes.
  7. Select Save to split the downtime event in the required number of target downtime events.

Results

The target downtime events appear in the table displaying the list of downtime events and their details in the Events page.

Merge Downtime Events

You can merge multiple downtime events into one event.

Procedure

  1. Log in to the Plant Applications Universal Client.
  2. Select .
    The Events page appears, displaying a list of downtime events and their details in a tabular format.
  3. Access the required downtime events list.
  4. In the Events page, select for each source downtime event that you want to merge into a single downtime event.
    Note: You can merge downtime events associated with the equipment from the same location only.
  5. Select to merge the selected events.

Results

The merged downtime event appears in the table displaying the list of downtime events and their details in the Events page.
Note:
  • When you merge downtime events, the time interval between the source downtime events is also added to the downtime duration of the merged downtime event.
  • If the reasons for downtime differ between the source downtime events, the new merged downtime event uses the reason associated with the oldest source downtime event.
Delete a Downtime Event

  1. Log in to the Plant Applications Universal Client.
  2. Select .
    The Events page appears, displaying a list of downtime events and their details in a tabular format.
  3. In the table displaying the list of downtime events and their details, select to delete a single or multiple downtime events.
    Note:
    • To delete a downtime event, select for the downtime event in the table displaying the list of downtime events and their details.
    • To delete multiple downtime events, select for each of them in the table displaying the list of downtime events and their details, and then select to delete the selected downtime events.

Results

The selected downtime events are deleted and no longer appear in the table displaying the list of downtime events and their details in the Events page.