
Save an Analysis Trend
About this task
Procedure
- Log in to the Plant Applications Web Client.
- Select
 .
.
The Chart Configuration page appears.
Note: For every new session, when you login and select for the first time, the default trend chart appears. You can close the chart to go back to the Chart Configuration page. - Select a plant model and data type for which you want to view the trend chart.
- Depending on the data type, select Add Chart or Add Batches, and then select Plot.
-
Select
 .
The Save Trend window appears.
.
The Save Trend window appears.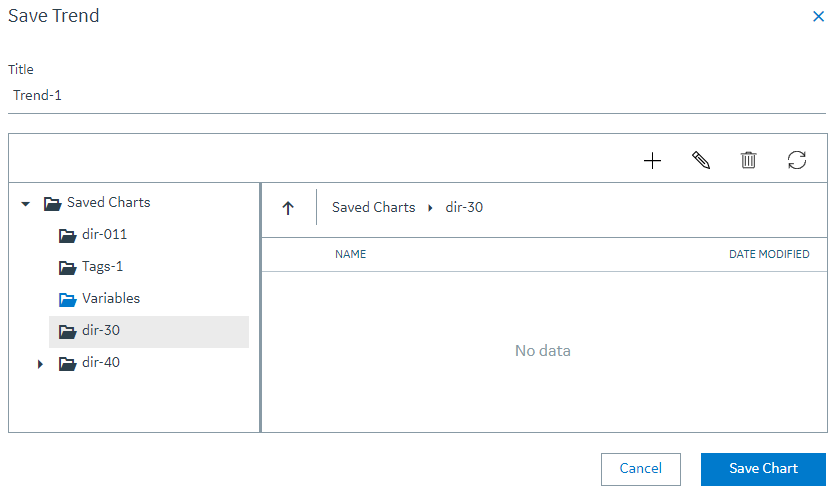
Each field that appears in the Save Trend window is described in the following table.
Field Description Title Enter a descriptive name for the chart. Saved Charts Displays the folder tree view under Saved Charts for you to save a trend. You can either select an existing folder or you can create a new folder using the  icon. You can perform below actions by selecting a required folder.Note: The
 icon indicates that the current default trend is saved in this folder.
Actions The actions that you can perform for saving a trend. You can select one of the following action items: - : Select to add a new folder.
 : Select to mark a trend as default. This appears only when you select an existing trend from a folder. For more information, refer Mark a Saved Trend as Default.Note:
 indicates that the selected trend is the current default trend.
 : Select to rename a folder or a trend name.
 : Select to delete a saved trend. For more information, refer Delete a Saved Trend.
 : Select to go a level above the current folder. Alternatively, you can use the breadcrumbs to navigate through the current directory.
 : Select to refresh the list of files and folders for a selected folder.
-
Select Save Chart.
The current analysis view is saved as an analysis trend and is accessible by all users.Tip: To restore or delete the saved trend, select
 in the Chart Configuration page. For more information, refer to the Restore a Saved Trend and Delete a Saved Trend topics.