Health Summary
About the Health Summary
The Health Summary provides an overview of information for an asset.
- Indicators: Displays the indicators and indicator statuses for the selected asset.
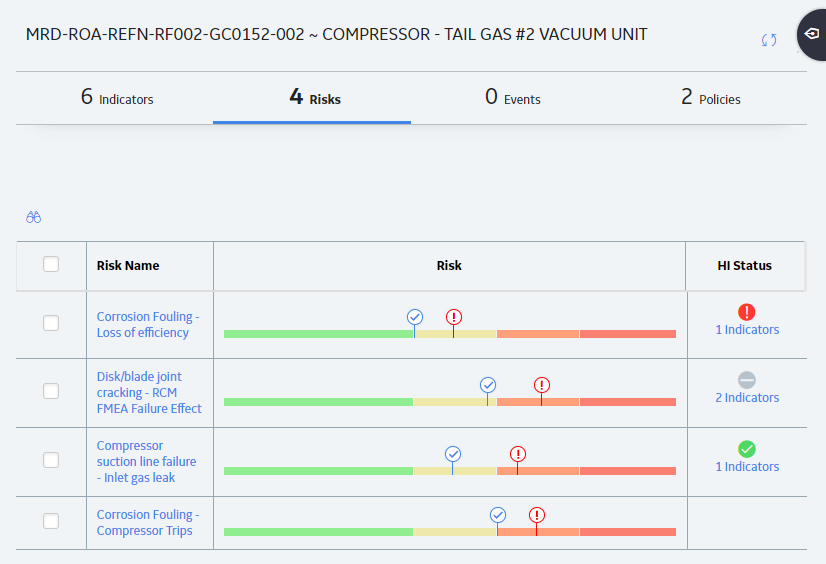
- Risks: Displays the risks and health indicator statuses that are associated with an Active Strategy that is associated with the selected asset.
- Events: Displays the events that are associated with the selected asset.
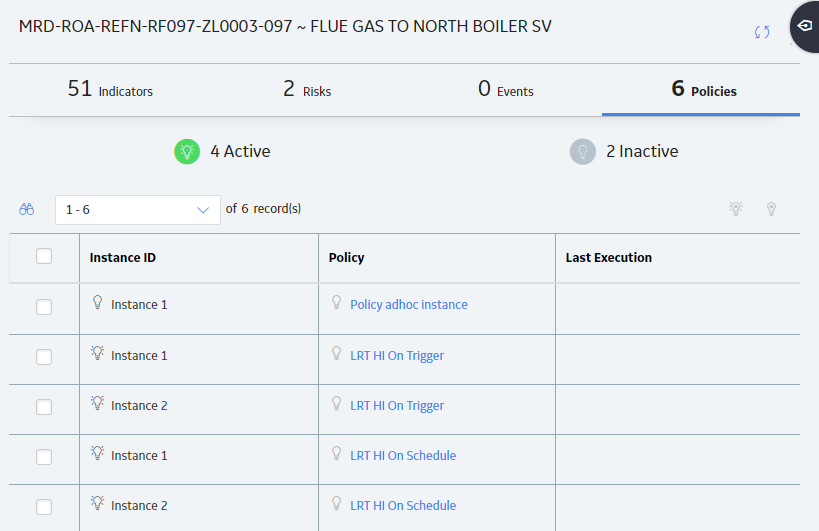
- Policies: Displays the policy instances associated with the selected asset.
Access Health Indicator Status Information for an Asset
Procedure
What to do next
About Health Indicator Statuses
The status of a Health Indicator record is based upon values that are stored in the Health Indicator record and the source records to which the Health Indicator record is linked. Each source record defines the upper and lower limit values that are compared to the most recent reading values in order to determine the status of a corresponding health indicator.
Status criteria for numeric health indicators
If a source record has numeric readings, the limits define a range of values that correspond to each health indicator status.
| Status | Color | Description |
|---|---|---|
| Normal | Green | The reading value falls between the lower level 1 limit and the upper level 1 limit. |
| Warning | Yellow |
The reading value is less than or equal to the lower level 1 limit and greater than the lower level 2 limit. -or- The reading value is greater than or equal to the upper level 1 limit and less than the upper level 2 limit. |
| Alert | Red |
The reading value is less than or equal to the lower level 2 limit. -or- The reading value is greater than or equal to the upper level 2 limit. |
For example, consider the following Measurement Location limit values:
- Upper Level 3 = 140
- Upper Level 2 = 130
- Upper Level 1 = 120
- Lower Level 1 = 110
- Lower Level 2 = 100
- Lower Level 3 = 90
Given these values:
- Normal = Any reading value greater than 110 and less than 120 (111 - 119)
- Warning = Any reading value greater than or equal to 120 and less than 130 (120 - 129), or less than or equal to 110 and greater than 100 (101 - 110)
- Alert = Any reading value greater than or equal to 130 (130 and above) or less than 100 (100 and below)
Status criteria for character health indicators
If a source record has character readings, the specific character values defined for each limit correspond to a specific health indicator status.
| Status | Color | Description |
|---|---|---|
| Normal | Green | The reading value is not defined in a limit value. |
| Warning | Yellow |
The reading value matches the value defined for either of the following limits:
|
| Alert | Red |
The reading value matches the value defined for any of the following limits:
|
For example, consider the following Measurement Location limit values:
- Upper Level 3 = Critical
- Upper Level 2 = Poor
- Upper Level 1 = Moderate
Given these values:
- Normal = Any reading value not otherwise specified in a limit level. For example, the reading Good would result in a normal status.
- Warning = Reading value Moderate.
- Alert = Reading value Critical or Poor.
Health Indicator Status Icons
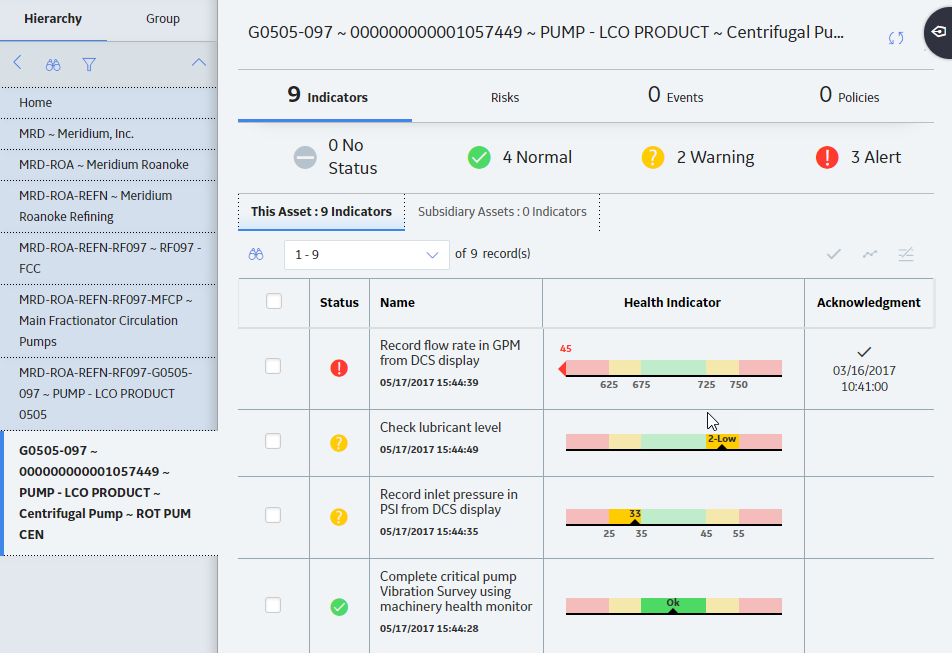
When viewing the Asset Health Manager page with an asset record selected in the Asset Hierarchy, a status icon appears next to each health indicator listed in the This Asset section and each asset listed in the Subsidiary Assets section.
The following icons are used to represent the various statuses of a health indicator.
| Status | Icon | Description |
|---|---|---|
| Normal |
| Indicates that the corresponding Health Indicator record meets normal status criteria. |
| Warning |
| Indicates that the corresponding Health Indicator record meets warning status criteria. |
| Alert |
| Indicates that the corresponding Health Indicator record meets alert status criteria. |
| No Readings |
|
Indicates that the health indicator source record of the corresponding Health Indicator record is not associated with any reading source records. For example, if the source record is a Measurement Location record, the status icon will be gray if the Measurement Location record is not linked to any Reading records. |
| No limit values | No icon | For numeric health indicators, if limit values are not defined in a health indicator source record, no status will appear for the corresponding health indicator. |
Out of sync statuses
The Asset Health Indicator service automatically updates either the Last Numeric Reading Value or Last Char Reading Value field in Health Indicator records to correspond to the reading in the most recent reading source record. If the Asset Health Indicator service is not running, or if there are many items in the service's queue to process, a Health Indicator record may not be updated immediately with the reading value from the most recent reading source record.
If this occurs, the corresponding status icon will appear in a lighter color to indicate that the status is out of sync with the latest reading. For example, suppose that the reading value in a Health Indicator record meets the alert status criteria, so the ![]() status icon is displayed. Then, suppose that a newer reading source record is created, but there is a delay in updating the reading value in the Health Indicator record. Until the Health Indicator record is updated, the status icon will appear in a lighter color (
status icon is displayed. Then, suppose that a newer reading source record is created, but there is a delay in updating the reading value in the Health Indicator record. Until the Health Indicator record is updated, the status icon will appear in a lighter color (![]() ) to indicate that the status is outdated and may change when the newest reading value is processed.
) to indicate that the status is outdated and may change when the newest reading value is processed.
If a health indicator status is out of sync, the problem may correct itself as the Asset Health Indicator service finishes processing items in the queue. If the problem does not correct itself, you should ensure that the Asset Health Indicator service is running properly.
Health Indicator Gauges
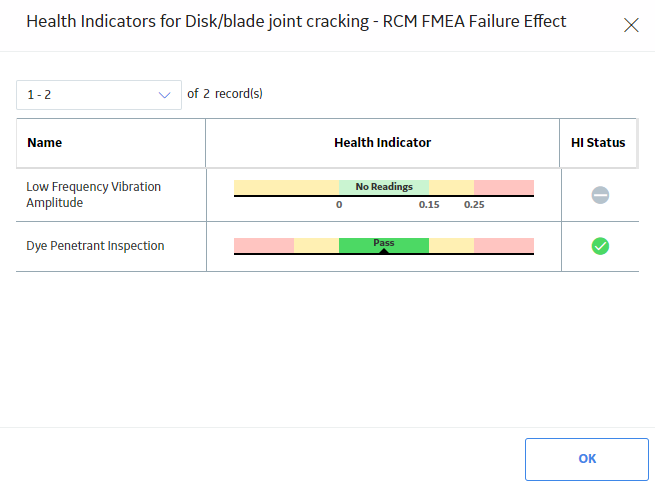
When viewing the Asset Health Manager page with an asset record selected in the Asset Hierarchy, the This Asset section contains gauges showing the latest reading value stored in the Health Indicator record in respect to the corresponding limit values.
Each gauge contains various colored sections that represent the status criteria that the Health Indicator record could meet. The latest reading value is displayed on the gauge, along with a black pointer that identifies the status of the reading.
The gauge displays details differently depending on the limit values that are defined, the reading values that exist, and whether the health indicator has character or numeric readings. The following table summarizes these scenarios.
|
Scenario |
Reading Type |
Description |
Example Gauge |
|---|---|---|---|
|
Latest reading falls within defined limits.
|
Numeric |
The latest reading is displayed proportionally to where the reading falls between the limit values. |
|
|
Character |
The latest reading is displayed in the center of the corresponding status section. |
| |
|
Latest reading does not fall within defined limits. |
Numeric |
The latest reading is displayed with an arrow pointing off the gauge in the direction of the exceeded limit. |
|
|
Character |
The latest reading is displayed in the center of the green status section. |
| |
|
A level 1 or 2 limit value is not defined for the health indicator.
|
Numeric |
The sections in a gauge are displayed based on the limit values that are defined. The latest reading is displayed proportionally in the corresponding section if the limit values provide enough information to determine the relative position of the reading, otherwise, the reading is displayed in the center of the corresponding section. |
|
|
Character |
The latest reading is displayed in the center of the corresponding status section. |
| |
|
The health indicator has no reading values associated with it, but limits have been defined. |
Numeric |
The text No Readings is displayed in the gauge along with the defined limit values. |
|
|
Character |
The text No Readings is displayed in the gauge. |
| |
|
The health indicator has reading values associated with it, but no limits have been defined. |
Numeric |
The latest reading is displayed in the gauge, but no limit values are shown. |
|
|
Character |
The latest reading is displayed in the center of the green status section. |
| |
|
The health indicator has no reading values associated with it and no limits have been defined. |
Numeric |
The text No Readings is displayed in the gauge. |
|
|
Character |
The text No Readings is displayed in the gauge. |
|
Access Event Information for an Asset
Procedure
About Events in Asset Health Manager
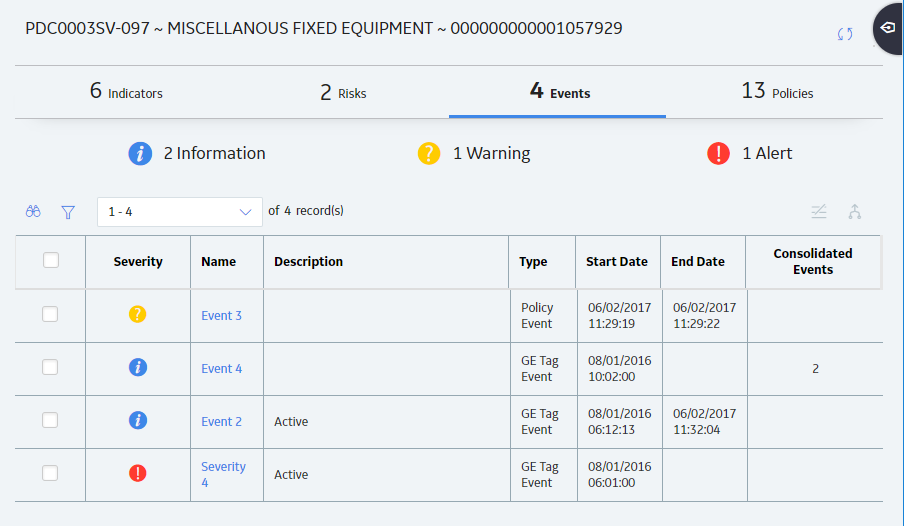
An event is an occurrence that takes place concerning an asset, such as an inspection or a repair. The Events section on the Asset Health Manager page provides a list of events related to the currently selected asset so that you can easily access this information while reviewing the health indicators for the same asset. You can also view events on the health indicator trend chart.
You can use the event information displayed in Asset Health Manager to monitor the condition of an asset, or to look for trends in the events. For example, if a health indicator has an alert status, you might review the related event information to determine the number of times that piece of equipment has operated outside of normal operating conditions, and for how long each time.
Event Source Records
The event information shown in Asset Health Manager comes from various event source records, such as Work History and Inspection records, that are linked to the selected asset record. Information in event source records is displayed in Asset Health Manager when event mappings have been defined for the event source family.
Event Severities
Events in Asset Health Manager are displayed along with a severity, which is the gravity or seriousness associated with the event. The following table describes the possible event severities.
| Severity | Icon | Description |
|---|---|---|
| Information |
|
Routine events not affecting asset health. For example, the severity would be information if the event source record represents a routine inspection on an asset. |
| Warning |
|
Events indicating a low-risk or early warning of asset health issues. For example, the severity would be warning if the event source record represents an activity that indicates that an asset is nearing its end of life. |
| Alert |
|
Events indicating a high-risk or imminent warning of asset health issues. For example, the severity would be alert if the event source record represents an activity that indicates that an asset is about to fail. |
Event Consolidation
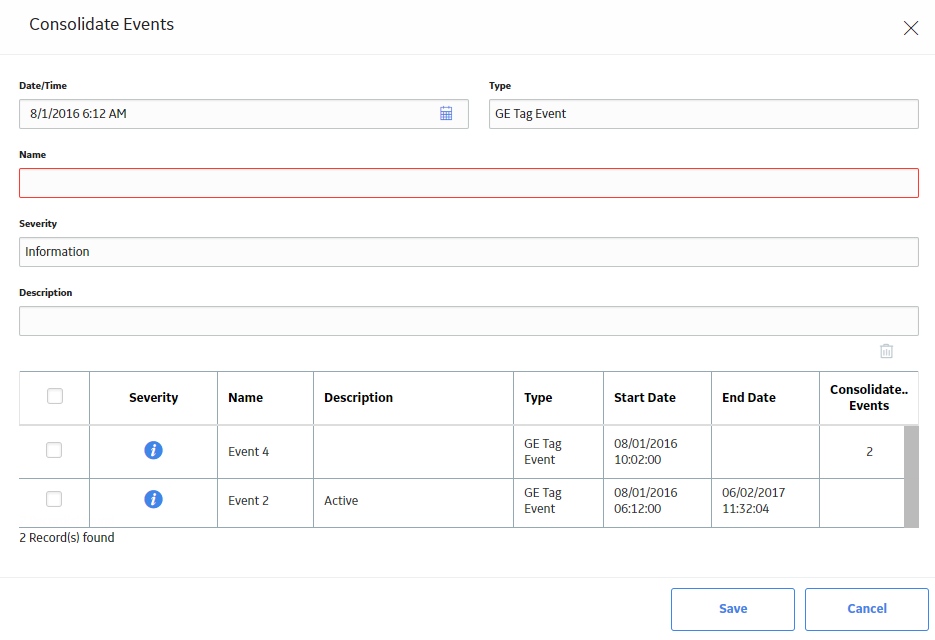
You can consolidate events in Asset Health Manager in order to group duplicate events into a single event, called a master event. Master events appear in the Health Summary page instead of the events that you consolidate, and you can manage them as any other event record in AHM.
You can only consolidate events of the same type. When you consolidate events, the Has Consolidated Events relationship links the events that were consolidated to the new master event record that is created during the event consolidation process.
Consolidate Events
Before you begin
Ensure that the family in which you want to consolidate events has been configured to allow event consolidation.
Procedure
Results
- A new record of the selected type is created in the GE Digital APM database.
- The event records that were consolidated are linked to the newly created master event record.
- The master event appears in the Health Summary page instead of the events that you consolidated.
Access Risk Information for an Asset
Procedure
Access Policy Instance Information
Activate or Deactivate a Policy Instance from Asset Health Manager
About this task
Procedure
Results
-
If you activated a policy instance, the instance will be executed according to the policy's execution settings.
Note: The corresponding policy must also be active in order for a policy instance to be executed. You can activate policies from Policy Designer. - If you deactivated a policy instance, the instance will not be executed.
 icon and the status is counted as normal in the cumulative status at the top of the page. If the acknowledgment has an expiration date (i.e., if it is not a one-time acknowledgment), that date also appears in the column.


 .
. .
. .
.
 ) and the Strategy Mitigated Risk Rank (
 ).
).
 ) or inactive (
 ).
). to activate the selected policy instances.
 to deactivate the selected policy instances.