On the Health Summary page, in the This Asset subsection, select the check box next to a health indicator, and then select
-or-
On the Asset Health Manager Overview page, select a health indicator name in one of the overview lists (i.e., No Status, Normal, Warning, or Alert).
The <Health Indicator Name>:<Description> page appears.
Note: If you select more than one health indicator, the Multiple Health Indicators page appears instead.
The date and time that the health indicator was last updated appears under the page heading and a link to open the Health Summary page for the related asset(s) appears on the right side of the page.
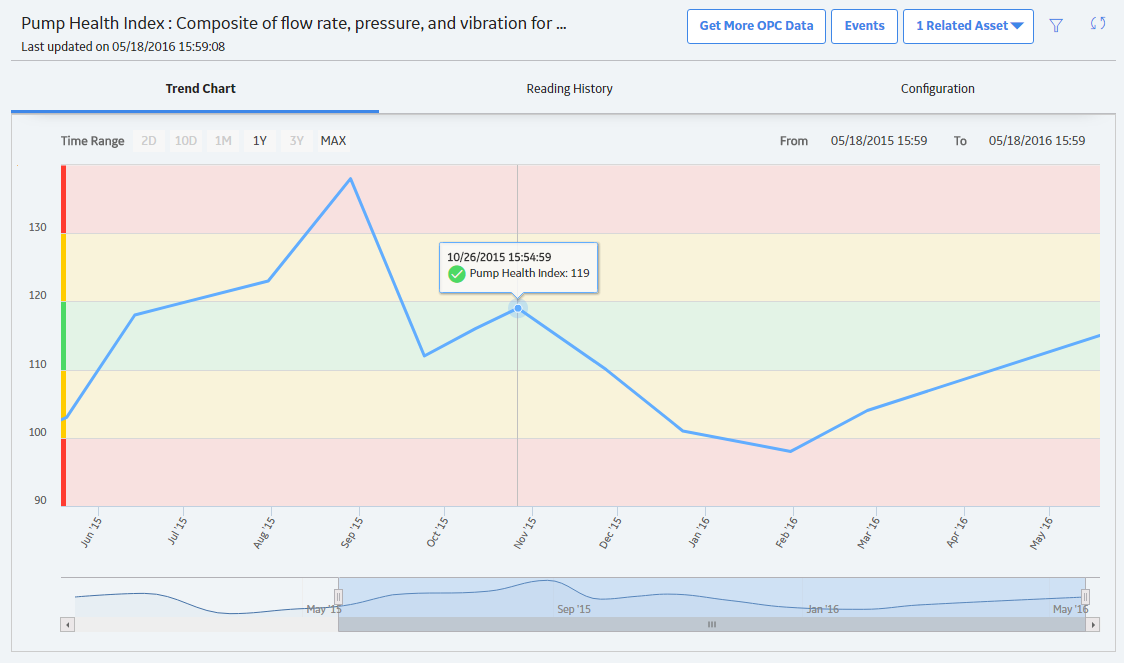
The Trend Chart workspace is displayed, which contains a trend chart showing how the health indicator readings have fluctuated over time.
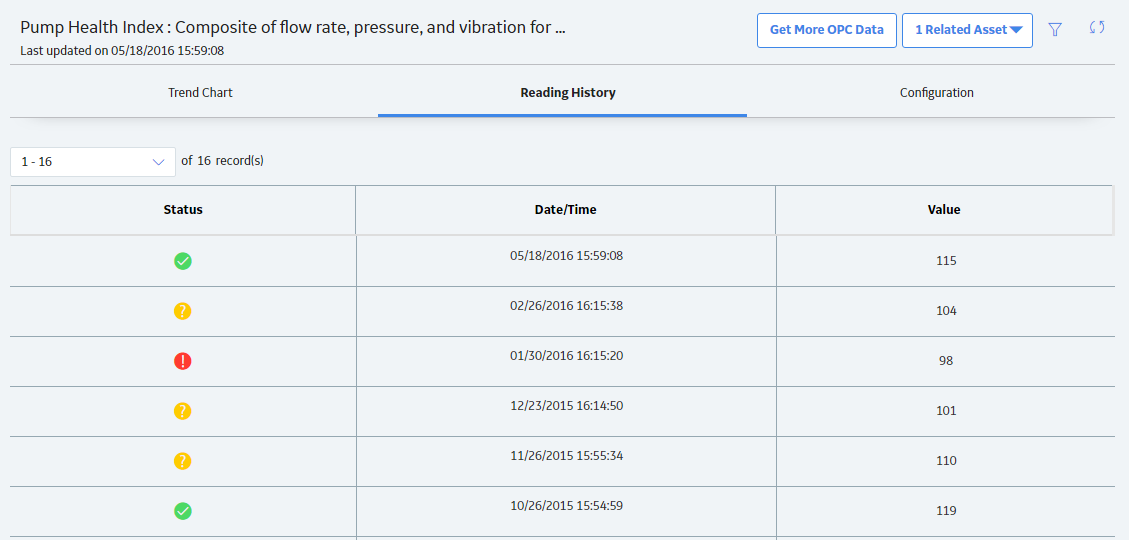
Select the Reading History tab.
The Reading History workspace appears, which displays the status, timestamp, and value of each reading for the selected health indicator.
Note:
- If the health indicator source is an OPC Tag record, the reading values displayed in the grid are the HDA readings directly from the process historian. Readings that are stored in the GE Digital APM database via OPC Reading records can only be viewed using Record Manager.
- By default, rows are sorted by the Date/Time column, with the most recent reading at the top.
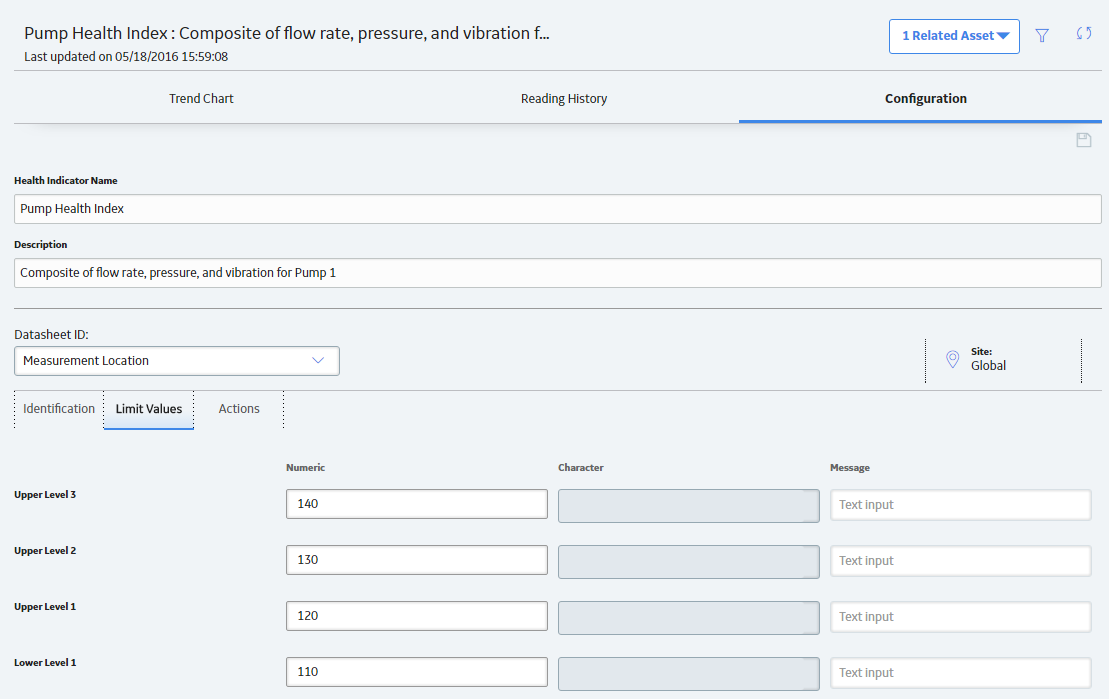
Select the Configuration tab.
The Configuration workspace appears, which displays the name, description, and limit values for the health indicator. You can optionally modify some of these values.