The Trend Chart workspace contains a graph that plots the readings values associated with a health indicator source.
If a health indicator source is an OPC Tag record, the graph displays a history of reading values that were collected by the process historian, assuming the following conditions have been met:
A connection to the OPC Server is available.
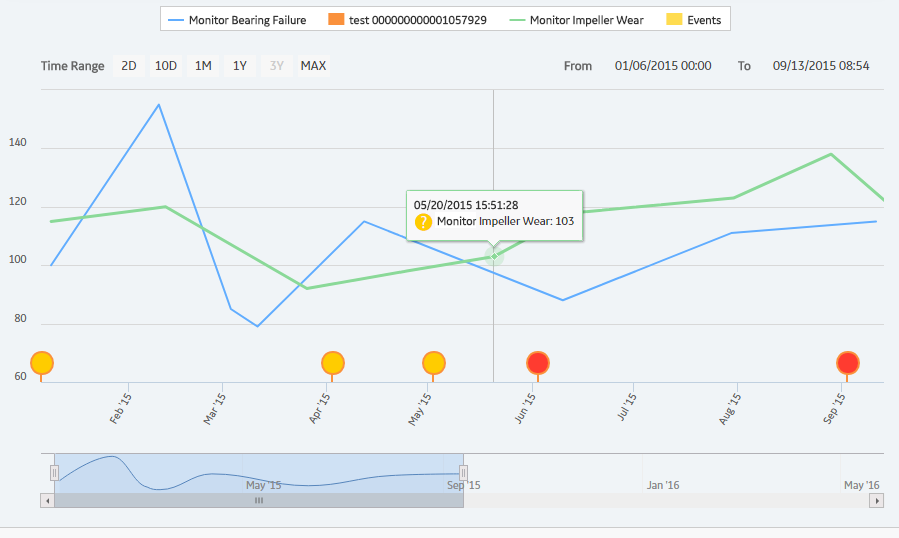
The following image shows an example of the graph when accessed for a multiple health indicators.
Numeric readings values are plotted on a line graph, while Character readings appear as circle markers along the x-axis. When you point to a line or marker, details of the reading and the related health indicator status appear, as shown in the preceding image.
The secondary graph below the main graph allows you to change the view of the main graph. You can shrink or expand the view by dragging the left or right border of the shaded area. You can drag the shaded area itself to show a different section of the main graph.
By default, the amount of reading data shown is based on the following criteria:
If the health indicator source is an OPC Tag record, the readings for the previous two days will be displayed on the graph, up to a maximum of 10,000 readings. To view additional data, you can:
Accessing the Trend Chart for Single vs. Multiple Health Indicator Sources
Depending upon how you access the Trend Chart workspace, some additional features are available.
When you access the Trend Chart workspace for a single health indicator source:
If the health indicator source is an OPC Tag record, the value, timestamp, and quality of the DA reading from the process historian appear above the graph. If DA Reading: Unavailable appears, it may mean that a connection to the process historian could not be established or that the information requested does not exist.
When you access the Trend Chart workspace for multiple health indicator sources, you can select the health indicator name in the graph legend to show or hide individual trend lines.
Viewing Events on the Trend Chart
When you display events on the trend chart, triangle markers showing when each event occurred appear for each event along the x-axis of the graph.
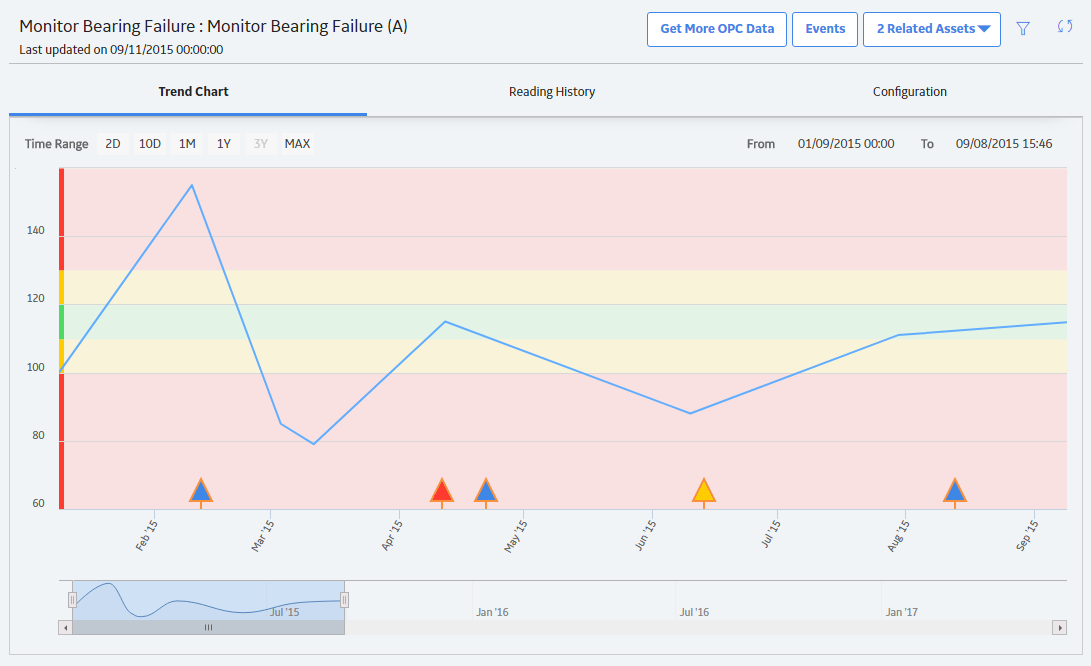
The color of each marker corresponds to the severity of the event. You can point to a marker to show details of the event.
Copyright © 2018 General Electric Company. All rights reserved.