Access the Trend Chart workspace in one of the following ways:
- For a single health indicator.
- For multiple health indicators.
- From another area of GE Digital APM, such as Rounds Designer.
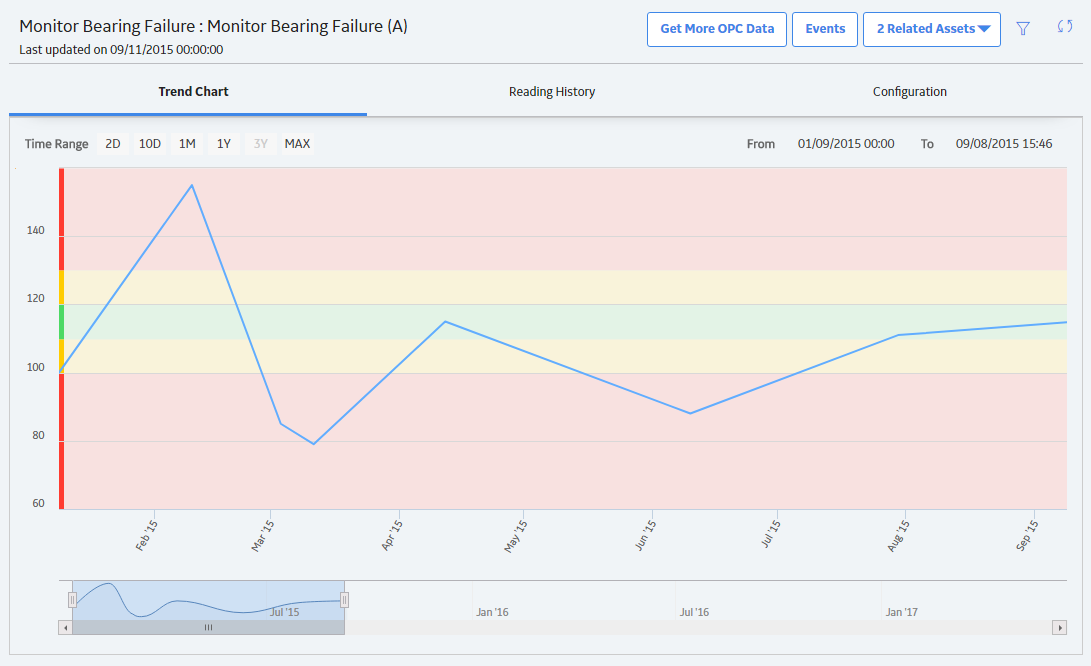
The Trend Chart workspace appears.
Select the Events button.
The Events Displayed on Trend window appears.
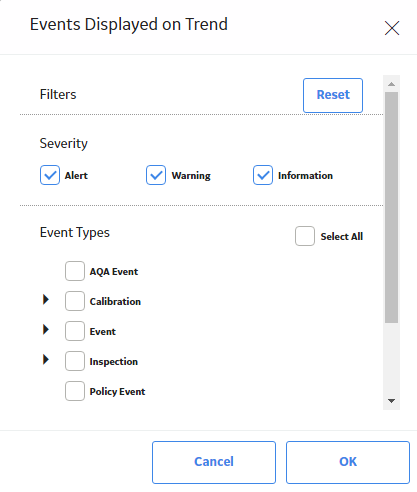
Select OK.
Triangle markers showing when each event occurred appear for each event along the x-axis of the graph.
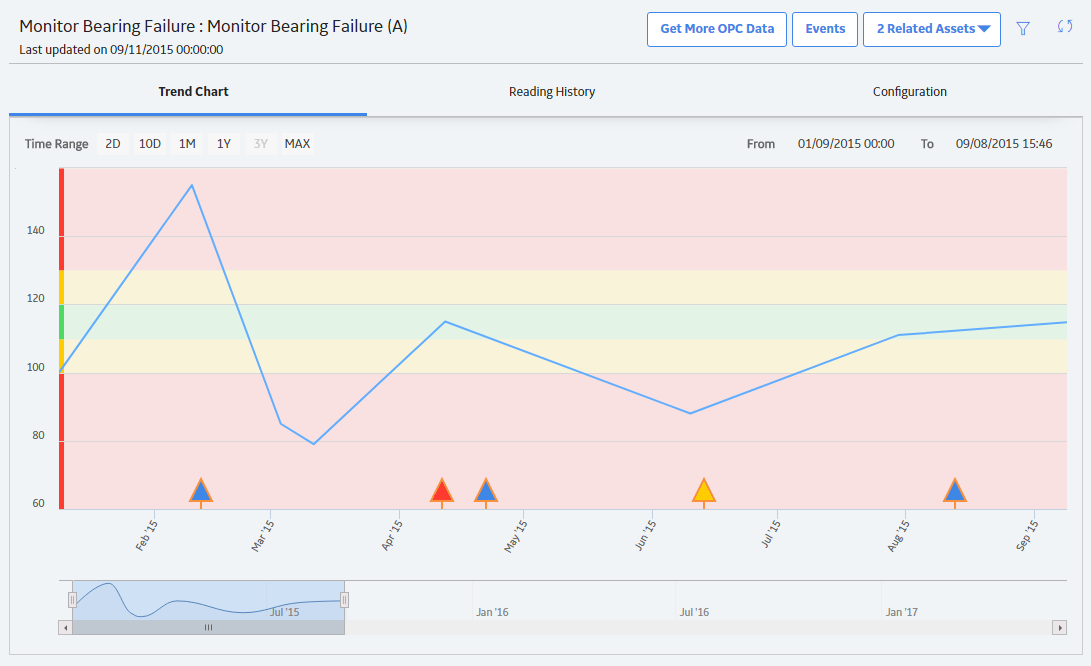
The color of each marker corresponds to the severity of the event. You can point to a marker to show the details of the event.
Optionally, to modify the date range on the Trend Chart workspace, select
The Filters menu appears.
As necessary, in the Date Range section, enter dates in the From and To boxes, and then select Apply.
Events are displayed based on the selected date range.