
 Operations Hub
Configuring a Trend Chart
Use the trend configuration settings to create or modify your charts.
- Access the trend chart whose settings you want to configure.
-
In the toolbar of the chart, select
 .
The Trend Configuration window appears.
.
The Trend Configuration window appears.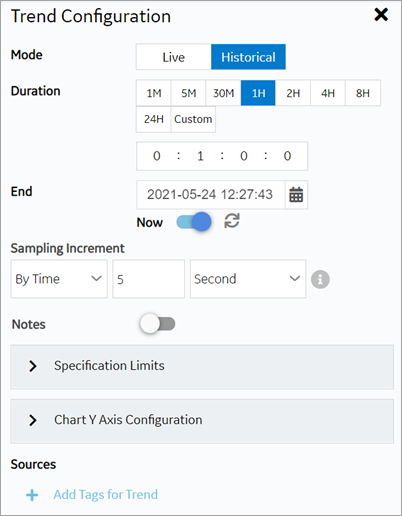
-
Modify the trend chart settings as specified in the following table.
Setting Description Mode Select the mode of the trend chart. The following options are available: - Live: Plots real-time data from a Historian server and/or OPC UA server.
- Historical: Plots historical data from a Historian server.
Note: Changes made to Live affect Historical as well. For example, if you add/delete properties from the chart in the Live mode, these changes reflect when you move to the Historical mode as well.Duration Select a duration for which you want to plot the data. The selected duration is subtracted from the End time to deliver past trends. You can go back in time in minutes, hours, or provide a customized duration. - 1, 5, or 30 minutes
- 1, 2, 4, 8, or 24 hours
- Choose Custom and enter a different duration in the time format text box.
End Allows to set an end date and time for trending historical data. Select
 to update a specific date and time.
- If you have set a date and time in the past, select Done to apply.
- If you want to set the current date and time, select Now to apply. The current time can also be set by enabling the toggle switch.
Now Allows to update the End time to your current system time. The toggle is enabled by default when you enter the Historical mode for the first time. Choosing a different date and time automatically disables the toggle. - Select
 to refresh ‘Now’ configured charts. Use this option
to instantly update the end time to current time if
the chart is already configured for ‘Now’.
to refresh ‘Now’ configured charts. Use this option
to instantly update the end time to current time if
the chart is already configured for ‘Now’. - You can also save a 'Now' configured chart as your
favorite. When you reload such charts from
favorites, the end time is set to the current system
time, and trends are displayed.Note: After upgrading to 2.1, values from previously saved favorites are updated to represent the range for end time instead of the start time. The ‘Now’ toggle remains disabled for old favorites.
Sampling Increment Select whether you want to increment the sampling data based on time or count, and then specify the time or count, respectively. 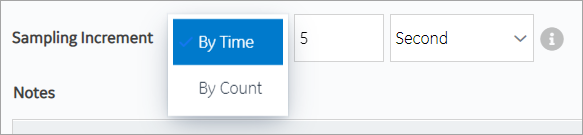 Note: The sampling increment may not always be honored. The maximum number of data points plotted on the trend chart is 3000 when sampling by time, and 8000 when sampling by count. You can zoom in to view more accurate data.
Notes You can add notes only to historical trends, and not for OPC UA based trends. Switch the toggle to enable viewing or adding a note on the trend chart.
On the trend chart:- To add a note for the first time for a specific
data point, select the data point, and then select
 .
. - To access a note, select
 . Note: You cannot modify or delete a note; if you want to augment a note, you can add additional notes.
 - To add an additional note for a data point,
select
 .
. - To navigate through multiple notes, use
 and
and
 .
.
When you access an existing note, the timestamp and tag values that appear during the initial loading of the note correspond to the x-axis and y-axis values for the data point, respectively. If you select each individual note, the actual raw and timestamp values to which the comment was added in the Historian archive appear.
If you add a note to an interpolated value, it is added to the nearest raw value. Due to this, the value displayed in the note may not always match the value plotted on the chart.
Sources Data can be plotted to the trend chart using properties from an asset model. In the absence of an asset model, you can also directly browse the data source address space and select tags for the trend chart. Select Add Tags for Trend to select the properties or tags that you want to add to the trend chart.
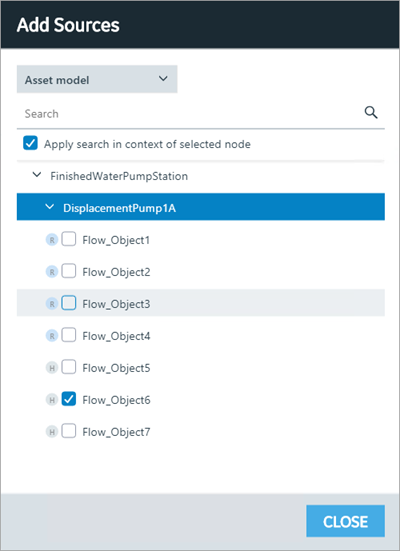
Tags marked as
 are from the Historian data source. Tags marked as
 are from the real time data
sources such as iFIX, CIMPLICITY, and any other OPC UA
server.Note: Nodes only work for plotting historical data. They do not work in Live mode.
are from the real time data
sources such as iFIX, CIMPLICITY, and any other OPC UA
server.Note: Nodes only work for plotting historical data. They do not work in Live mode.SAMPLING MODE For each tag SOURCE, you can add multiple sampling modes. This option is available only for the historical mode. Select [Add Sampling Mode] to add additional sampling modes for a tag. For example, you can have 3 different sampling modes for a single tag in the trend chart. Highlight each mode with a different line color, style, and thickness.
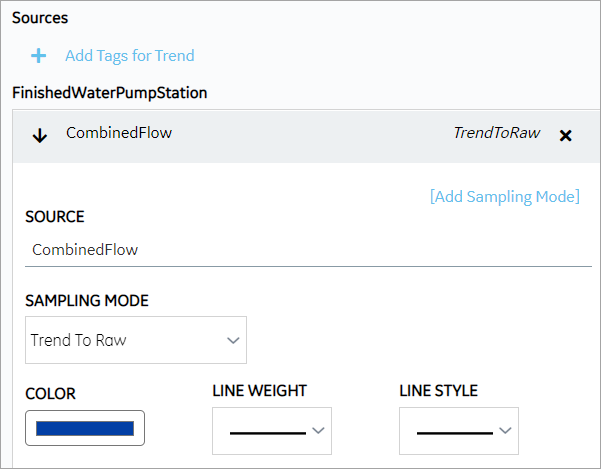
These are the modes available to plot data:
- Trend To Raw
- Minimum
- Maximum
- Average
- Total
- Standard Deviation
- Interpolated
- Lab
- Lab To Raw
You can trend each tag-sampling mode combination only once. For example, if Trend To Raw mode is applied to Water Temp tag, this mode becomes inactive for this tag. The other modes are available to use.
To delete a plotted sampling mode, select
 next to the
tag.
next to the
tag.Specification Limits Select to define upper, lower, and targeted limits to monitor the process performance. 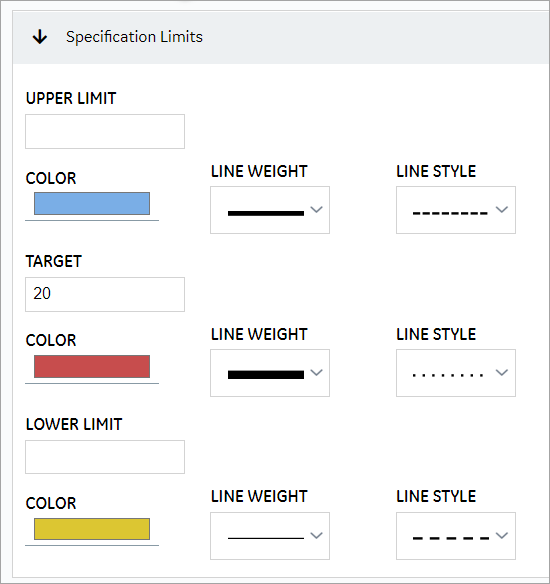
Enter values for all or any of the limits to plot these lines on the trend chart. You can highlight each plotted line with a unique line color, thickness, and/or style.
You can set the specification limits for both live and historical mode, and save the chart to favorites.
COLOR Select to color code each trend line for unique identification. LINE WEIGHT Select to highlight each trend line with a unique line width. LINE STYLE Select to highlight each trend line with a unique line style. Chart Y Axis Configuration Allows to compare two or more tags/sources by having a common Y-axis on the trend chart. - Individual Y Axis for each source: Select this option to include an individual Y-axis for each source on a trend chart. For example, if you have multiple tags trending on your chart, each tag has its own Y-axis.
- Single Y Axis for all sources: Select this option to include a common Y-axis for all the sources on a trend chart. For example, if you have multiple tags trending on your chart, all the tags share only a single Y-axis.
SHOW Y-AXIS Select the toggle to switch between showing or hiding the y-axis on a trend chart. This option is available under each tag/source if you selected individual y-axis for each source. AUTOFETCH LIMITS By default, the toggle is always turned on, to automatically fetch minimum (Low) and maximum (High) limits. Turn off the toggle if you want to provide manual limits for the chart. Enter values for AXIS LOW and AXIS HIGH to trend the data accordingly. In case you do not enter High and Low limits when the toggle is off, the values are auto scaled. For Individual Y-axis, the option to set limits is available under each tag/source.
For Single Y-axis, you can browse and select the tag/source, and set custom limits. Turn on the toggle to be able to browse tag/source.