Timeline
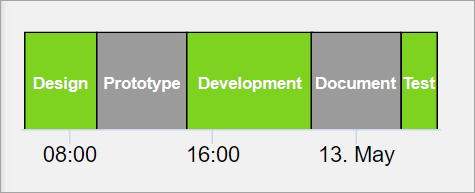
Use the timeline widget to visually monitor the progress of your events.
Generally used for time-based events, the timeline widget can monitor the status of a machine and update the events that occurred over a time period. It can capture data on how long a machine was running, or remained in an idle state. To visualize multiple events against a single time period, add multiple timelines aligned to the same X-axis on a chart.
The timeline widget is available under . When designing application pages,
drag-and-drop  to a container.
The following list of properties are specific to this widget. For common properties, refer to Page Components.
| Property | Description |
|---|---|
| Trigger actions on the timeline selected event. | |
| Title | Enter a title to help identify the timeline at runtime. |
| Font Color | Select a font color for the widget text. |
| Show Border | Select the check box to add a border to the timeline widget. A border frames the widget and provides a clean look. |
| Border Color | Select a color for the border. |
| Show X-axis Labels | Select the check box to show the X-axis ticks on the widget at runtime. Clear the check box to hide the ticks. |
| Width | Enter a width for the timeline widget. |
| Height | Enter a height for the timeline widget. |
| Event Table Datasource | The event table helps to match the colors and labels. It enables the
widget to assign a specific color and label to an incoming event. When a value from the result set matches a value from the event table, then the configured color and label applies to that entry. You can configure an event table either manually, or get data from a data source. Select the
output fields in this order:
Use any of these options to get data from a data source:
Note: Currently, we only support the option to use a query output to
retrieve data. |
| Point Primary Color | Serves as the first color in the zebra striped color pattern. Select a primary color to apply to the timeline event table if not retrieving values from a datasource. |
| Point Secondary Color | Serves as the second color in the zebra striped color pattern. Select a secondary color to apply to the timeline event table if not retrieving values from a datasource. |
| Event Table Manual | You can create event table entries manually. In the absence of an
Event Table Datasource, these entries are used for
retrieving data for the timeline events.
Events that do not match an entry from the event table are assigned the Point Primary Color or Point Secondary Color. |
| Datasource Values | Configure one or more data sources to get values for the timeline
widget. When you add multiple data sources, you get a single view for
multiple timelines all aligned to the same X-axis. It allows you to compare
data at different time intervals. To configure a data source:
Note: Currently, we only support the option to use a query output to
retrieve data. |
| Input Datetime Format | Select from local or UTC. |
| Start Sample | Select the Enable check box to insert an event at the start of the timeline. Then, specify the start timestamp. |
| Datasource Start Timestamp | Use any of these options to provide start timestamp values from a data
source:
|
| Datasource Start Value | Use any of these options to provide event value at the start (after
timestamp) from a data source:
|
| End Sample | Select the Enable check box to insert an end time for the last event on the timeline. Then specify the end timestamp. |
| Datasource End Timestamp | This is the final timestamp for the last event in the query. It is
required to specify an end timestamp to get all the values from last queried
batch on display. Use any of these options to provide end timestamp values from a data source:
|
| Output Targets | You can configure output targets for a selected event. At runtime, these
targets trigger only on selecting the respective event.
You can add one or more output targets for an event.
|
 and
and  to reorder output
targets. The output targets are implemented in the specified
order.
to reorder output
targets. The output targets are implemented in the specified
order. to delete an output target.
Timeline at Runtime