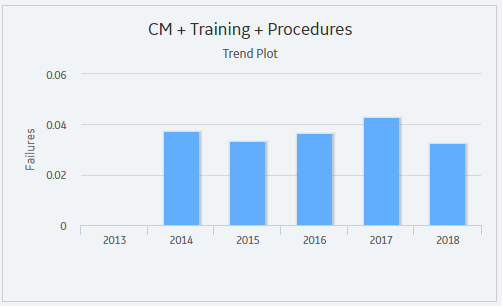
The Trend Plot provides the average value for each analysis time interval, as defined by the value in the Time Analysis Type field in the root System Analysis record, of the result that you selected in the grid.
If the Time Analysis Type field is set to:
Note: Interaction with graphs is not available on touch-screen devices.
Copyright © 2018 General Electric Company. All rights reserved.