Operations Hub
Line Chart
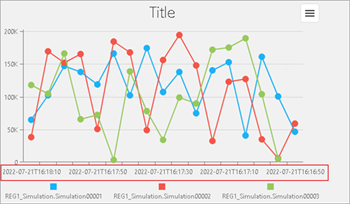
In a line chart, data points are connected by a line to help visualize the changes in data trends over a period a time.
The widget is available under . When designing application pages, drag-and-drop Line Chart to a container.
Line Chart Properties
| Field Name | Description |
|---|---|
| Line Type | Select from the available list of chart line types. |
| Source > Data Source | Provide the input data source to receive values for the chart. |
| Use Raw Format | Select the check box to display numbers in raw format. For example, a numeric value with 5 or more decimal places is shown as it is, and not rounded off. |
| Number of decimals | This option appears if you do not want to display numbers in raw
format. In that case, enter the decimal places (0-7) to consider after the decimal point to format large numbers. Based on the decimals, the value is rounded off to the nearest whole number. |
| Title | Title name for the chart. |
| Subtitle | Subtitle name for the chart. |
| Y Axis Title | Title name for y-axis. |
| X Axis Title | Title name for x-axis. |
| X Axis Mode | Format the x-axis:
|
| X Axis Rotation | If you choose to rotate labels, enter the degree of rotation. |
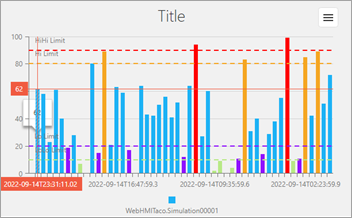
| Enable Line Limits | Select/Clear the check box to show/hide line limits. If you choose to show line limits at runtime, then enter the HiHi, Hi, Lo, LoLo limit values. |
| Labels External | Enables external labels for the limits. |
| HiHi Label | Enter a label name for HiHi limit. |
| HiHi | Use the available options to configure the source values. Refer to Bind Your Data to Plug-ins. |
| HiHi Color | Select a HiHi line color. |
| Hi Label | Enter a label name for Hi limit. |
| Hi | Use the available options to configure the source values. Refer to Bind Your Data to Plug-ins. |
| Hi Color | Select a Hi line color. |
| Lo Label | Enter a label name for Lo limit. |
| Lo | Use the available options to configure the source values. Refer to Bind Your Data to Plug-ins. |
| Lo Color | Select a Lo line color. |
| LoLo Label | Enter a label name for LoLo limit. |
| LoLo | Use the available options to configure the source values. Refer to Bind Your Data to Plug-ins. |
| LoLo Color | Select a LoLo line color. |
| Legend | Select the Visible check box if you want to show
the chart legend. You can also use the vertical/horizontal options to position the legend in the chart. |
| Crosshair | Select the check box if you want to show the crosshairs in the chart. |
| Show Points | Select the check box if you want to show data points in the chart. |
| Point Symbol | Select from the available list of symbols to represent the points in the chart. |
| Stacking |
|
| Truncate X-Axis | Select the check box to truncate the x-axis labels. |
| Hidden | Select this check box if you want to hide the
plug-in. To show the hidden plug-in in Operations Hub new layout, go
to Page Visuals and under
Action column, select |
Chart Line at Runtime
+ for
timestamp.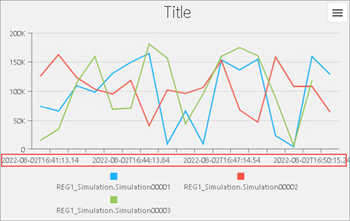
- for
timestamp.