Reliability Growth Analyses

About Reliability Growth Analysis

A Reliability Growth Analysis can help you make strategic decisions by indicating whether your data measurements are random or if they follow a trend. The graphs produced by a Reliability Growth Analysis will show any time-dependent trends, allowing you to make decisions based on past behavior and predict how your data will behave in the future.

Details

When you access the results of a Reliability Growth Analysis, if you see the data is trending in one direction until a certain point in time and then begins trending in another direction, you can examine what changed at the point in time when the trend shifted to determine the impact of those changes. In addition, if you make a strategy change and then examine whether the data worsens or begins to improve at that point, you can determine the impact of the strategy change. For example, a distinct change in a Mean Time Between Failures (MTBF) plot can identify the point at which improved maintenance strategies were put into place for a piece of equipment.

Similarly, when you observe data that is trending at the same rate over time without distinct changes, you can use those trends to predict the data's future behavior. For example, if you are tracking the cost associated with running a piece of equipment over a certain period of time, and the cost is consistently higher during winter months, you can predict how much more it will cost to run the piece of equipment in December than it will in July.

Trend charts generated by Reliability Growth Analysis can also show outlying events that may have had significant effects on the overall trend of strategy effectiveness. For example, a thunderstorm that results in a two-day power outage at a plant should not reflect poorly on a piece of equipment's reliability. Reliability Growth Analysis allows you to ignore these types of events.

You can perform a Reliability Growth Analysis and examine trend charts for one piece of equipment or location or a group of similar pieces of equipment or locations. For example, you may want to examine trends for one pump that is constantly breaking down, or you may want to examine trends for a set of pumps to detect any improvement after you installed a new maintenance strategy.

Access a Reliability Growth Analysis

Procedure

  1. Access the RA Overview page.
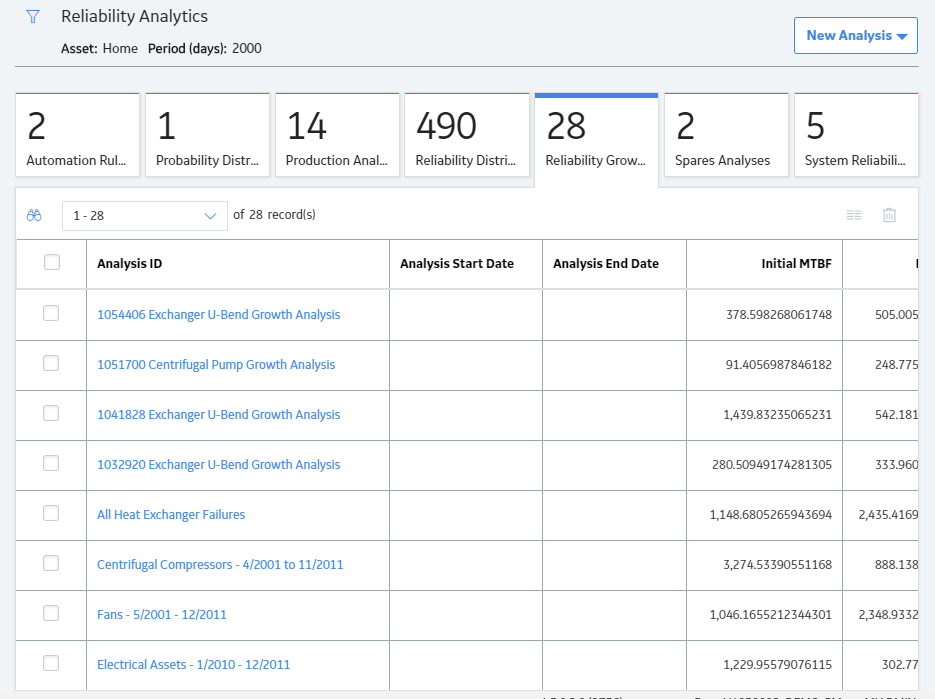
  2. Select the Reliability Growth tab.

    A list of Reliability Growth Analyses available in the database appears.


  3. In the Analysis ID column, select the hyperlink for the analysis that you want to view.

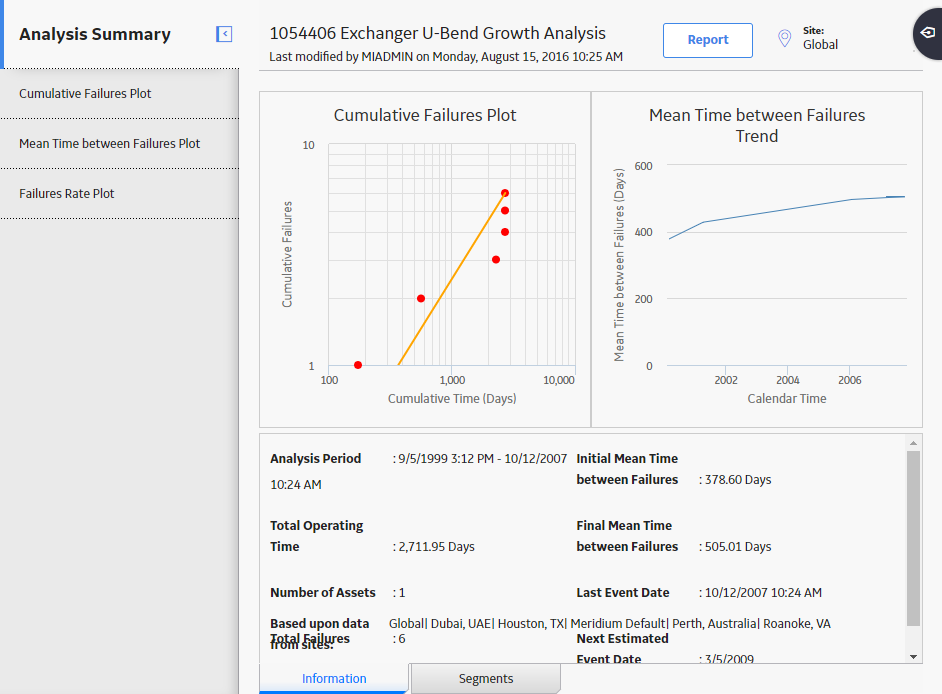
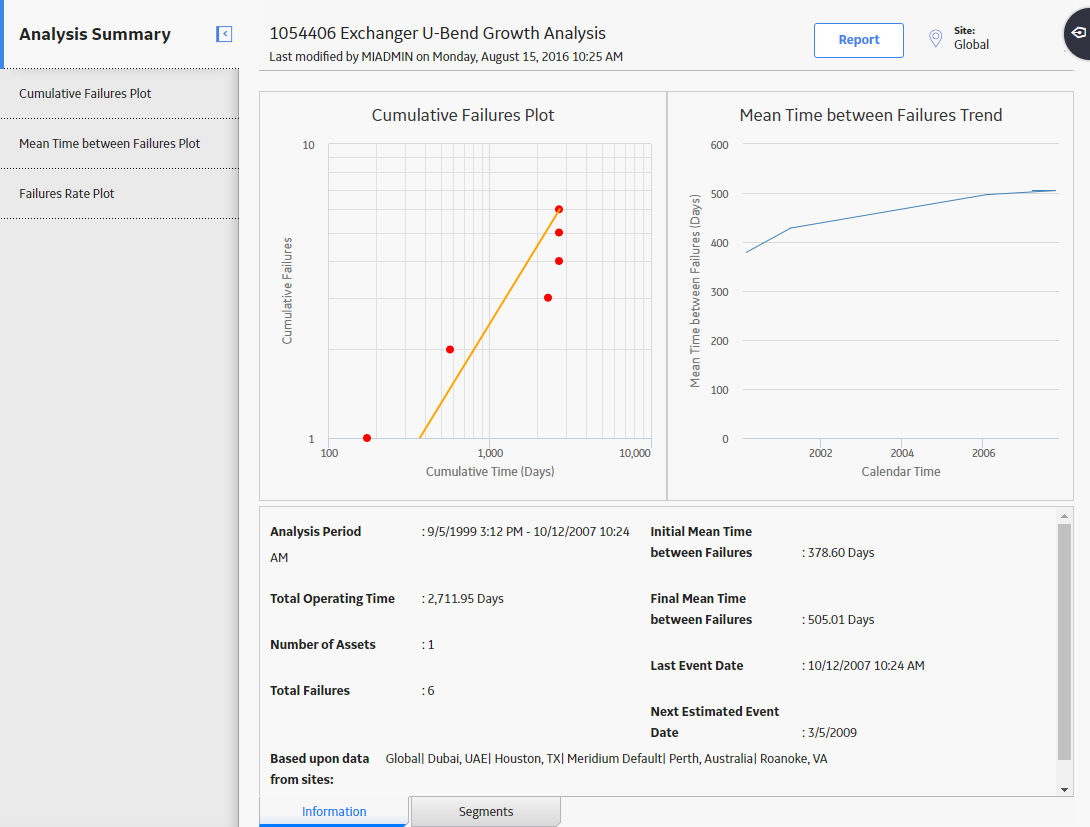
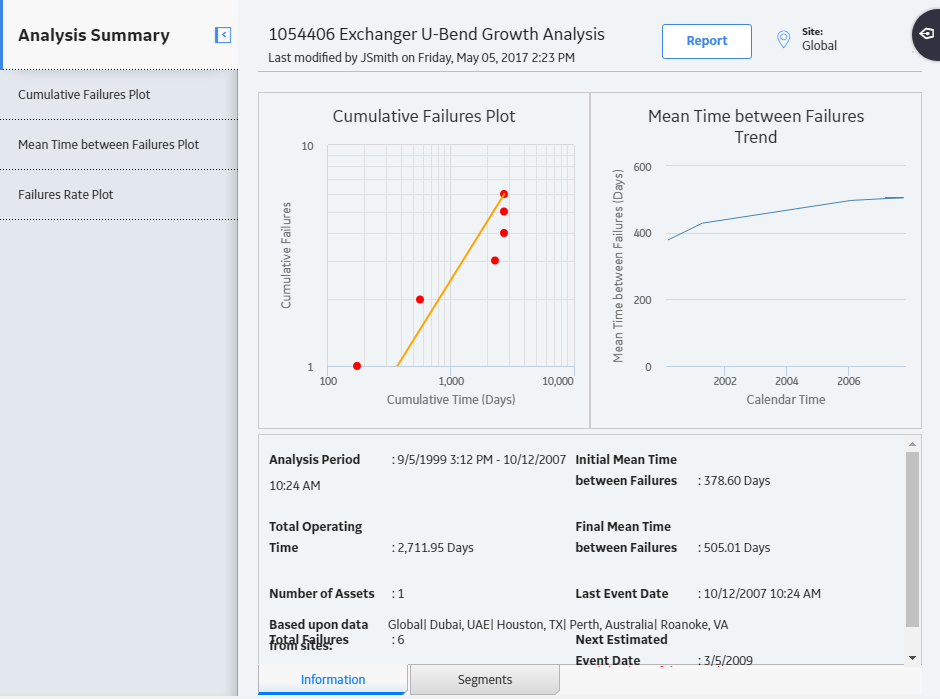
    The Reliability Growth page appears, displaying the Analysis Summary workspace.


    The Analysis Summary workspace contains the Cumulative <Measurement> plot and the MTB<Measurement> plot. These plots are read-only plots. To edit a plot, you must select the corresponding tab from the left pane. The information displayed on this tab will look different depending on the type of data that you use for your analysis.

    The bottom section of the workspace contains the Information and Segments tabs.

    The Information tab displays the following information:

    • Analysis Period: Contains the start and end dates of the analysis. If the analysis is based on cumulative operating time, it will be the start and end times of the analysis (e.g., 11,000 miles - 303,000 miles).
    • Total Operating Time: Contains the total amount of cumulative time that the Assets are in operation during the specified analysis period. For example, if you run one piece of equipment for 10 days, the total operating time is 10 days. If multiple Assets are included in the analysis, their operating time will be added together. Therefore, two Assets running for 10 days would have a total operating time of 20 days.
    • Number of Assets: Contains the number of Assets included in the analysis.
    • Total <Measurement> : Contains the total number of measurements (e.g., failures, cost) for all Assets in the analysis. The caption of this item will change depending on the measurement name.
    • Initial Mean Time Between <Measurement> : Contains the Mean Time Between <Measurement> at the beginning of the analysis. This item is displayed only for analyses using event-based data.
    • Final Mean Time Between <Measurement> : Contains the Mean Time Between <Measurement> at the end of the analysis. This item is displayed only for analyses using event-based data.
    • Last Event Date: Contains the last <Measurement> date in the analysis. This item appears only for an analysis using event-based data.
    • Next Estimated Event Date: The next estimated <Measurement> date, calculated by the GE Digital APM system. This item only appears for an analysis using event-based data.

    The Segments tab displays the following columns:

    • Segment: Contains a hyperlink, which you can select to view the details of the AMSAA model.
    • Start Date: Contains the start date for the segment. For the first segment, this is the same as the analysis start date. For subsequent segments, this is the end date of the previous segment.
    • End Date: Contains the end date for the segment. For the last segment, this date is the same as the analysis end date. For multi-segment analyses, the end date of one segment is always the start date of the next segment.

      Note: For a Reliability Growth Analysis based on cumulative operating time, the Start Date and End Date columns will be Start Time <units> and End Time <units>.
    • Termination Type: Contains a value that indicates whether the end date is event-based, time-based or grouped data. If you select the Time-Based option on the Set Analysis Period window, the value in the Termination Type column will be Time-Based. Likewise, if you select the Event-Based option on the Set Analysis Period window, the value in the Termination Type column will be Event-Based. If the analysis contains grouped data, the value in the Termination Type column will be Grouped-Data.

      Note: If the Cumulative <Measurement> plot contains more than one segment, the Termination Type may vary between segments. If the analysis is Event-Based, all segments will be event-based. If the analysis is Time-Based, however, the last segment will be Time-Based, but the Termination Type for all other segments will be Event-Based.
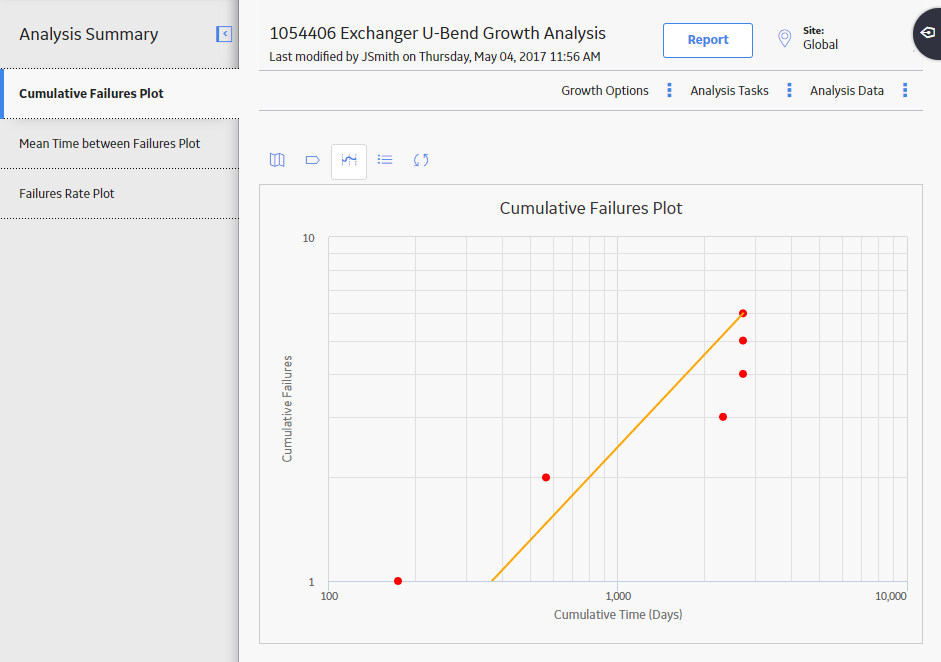
    • Beta: Contains a value representing the slope of the line in the Cumulative <Measurement> Plot. The Beta value helps serve as an indicator of whether the Mean Time Between <Measurement> is increasing, decreasing, or staying the same.
    • Lambda: Contains a scale parameter that equals the Y-intercept of the Cumulative <Measurement> Plot at time t= 1. This value is used to calculate the time to next measurement (e.g., failure, cost).
    • GOF Statistic: Contains a value calculated by a Cramer-von Mises or Chi-squared test that indicates the preciseness of the fit.
    • Critical Value: Contains a standard value used to determine whether the analysis passes the goodness of fit (GOF) test.
    • Passed GOF: Contains a value that indicates whether the segment passes the GOF test.
      • The analysis passes the GOF test (i.e., the Passed GOF check box is selected) when the GOF Statistic is lower than the Critical Value.
      • The analysis fails the GOF test (i.e., the Passed GOF check box is cleared) when the GOF Statistic is higher than the Critical Value.

    The left pane in the workspace contains the following tabs:

Types of Reliability Growth Analysis

Before you can perform a Reliability Growth Analysis, you must collect data, or numeric values representing some variable's performance, over some period of time. All data that you collect will be:

  • Based on events (e.g., a failure).

    -or-

  • Not based on an event, i.e. based on the consequence of an event (e.g., repair cost).

Both data that is event-based and not event-based will also be:

  • Grouped (i.e., datapoints represent multiple measurements or an amount).

    or-

  • Non-grouped (i.e., datapoints represent a single measurement).

By default, the GE Digital APM system assumes that your data is not grouped. You can specify that your analysis includes grouped data by including the amount of data per datapoint on the Select Data Fields screen. Data that is not event-based typically measures an amount (e.g., repair cost) and is grouped data.  

Event-based data can be derived from:

  • Failure Dates: Specific dates on which failures occurred. (e.g., 1/3/2012)
  • Cumulative Operating Time: An amount of time that has passed since the piece of equipment was put into service (e.g., 10 days).

Data that is not event-based is usually derived from cumulative operating time.

About Evaluating Results of a Reliability Growth Analysis

Reliability Growth Analysis results are made up of multiple parts that together demonstrate an overall picture of your data. You can view the results in graphical form, use calculated values to interpret the results, and perform additional tasks to help you determine the trends in your data and whether they are getting better or worse.

Viewing the Data Trends

The following list gives a brief description of the graphs that display the data:

  • Cumulative <Measurement> plot: Displays the number of measurements recorded for the Asset as a function of time. Since the log (cumulative measurement) versus the log (cumulative time) is linear, the plot line is a straight line. You can use this plot to see how your data is trending over time.
  • Mean Time Between <Measurement> Trend plot: Reflects how frequently measurements are being recorded for pieces of equipment or locations (e.g., failures, cost) as a function of time (cumulative operating time). If the trend in this plot is:

    • Increasing, measurements are being recorded less often (e.g., if a measurement is taken every time the Asset fails, the Asset is failing less often). This indicates that the Asset is becoming more reliable.
    • Decreasing, measurements are being recorded more frequently (e.g., if a measurement is taken every time the Asset fails, the piece of Asset is failing more often). This indicates that the Asset is becoming less reliable.
  • <Measurement> Rate Trend plot: Reflects the rate of your measurements (e.g., failures, cost). This plot can tell you a measurement per time unit, so that you can see per day or per month when measurements increase or decrease.

Interpreting the Data Trends

The following list gives a brief description of the values calculated by the GE Digital APM system that you can use to interpret trends within your data:

  • Goodness of Fit: Helps you determine if the measurements are following a pattern or occurring at random.
  • Confidence: Indicates the percentage of uncertainty of the Goodness of Fit method. The confidence level you select for your data helps determine whether or not the data will pass the Goodness of Fit test.
  • The Beta Value: Helps you interpret the MTB<Measurement> Trend plot. This value is displayed on the Reliability Growth page.
  • Next Estimated Event Date: Provides an estimate of the amount of time you can expect to pass before the next event will occur for the piece of equipment or location. The value is calculated using the last datapoint and the MTBF or measurement rate. The approximate date (or time) when the next event will occur is displayed on the Reliability Growth page.
  • Initial and Final MTBF or Initial or Final <Measurement> Rate: Helps you compare how the piece of equipment or location is behaving at the beginning of the analysis versus the end of the analysis. Using these values, you can determine if the piece of equipment's or location's measurement rate has improved or deteriorated over the analysis period. These values are displayed on the Reliability Growth page.

Additionally, you can view the AMSAA Reliability Growth Model page for an overview of the formulas used by the GE Digital APM system to calculate the model results.

Using Tools to Enhance Results

The following tools can further assist you in interpreting and applying analysis results:

  • Splitting an analysis: Allows you to divide an analysis into multiple parts so that you can see multiple trends in the data (e.g., data before and after a strategy change).
  • Extrapolation: Allows you to estimate the number of measurements (e.g., failures, amount of cost) that will have occurred by some point in the future.

Based on the analysis results, you can generate recommendations for the maintenance and reliability activities that should be executed in the future to maintain best practices in your organization.

About the Beta Value and MTBE

The Reliability Growth page displays the Beta and Lambda values as calculated by the application based on your data. The Beta value indicates whether MTBE is increasing, decreasing, or remaining constant.

Details

The following table lists the relationship between Beta value and MTBF and how they affect the reliability of an equipment:

Beta ValueMTBFEquipment Reliability
β = 1 Unchanging MTBE (predictable failures) If the Beta value is equal to or close to one (1), then the reliability is constant, and time is not a major factor.
β < 1 Increasing MTBE (improving reliability) If the value of Beta is less than one, the reliability of the equipment is improving over time.
β > 1 Decreasing MTBE (deteriorating reliability) If the value of Beta is greater than one (1), then the reliability of the equipment is deteriorating over time.

If the Beta value indicates that the MTBE is increasing or decreasing, you can try splitting the failure data up by time, failure mode, operating time, or some other appropriate value to create a set of data where the Beta value is closer to one. If you choose to split the data into time periods, you might try to split a single analysis into multiple segments.

Collect Data for a Reliability Growth Analysis

The following table lists the data that you must collect to build a Reliability Growth Analysis.

Data Needed Description Notes

Asset ID

An ID that uniquely describes a piece of equipment or location, such as Asset ID or Tag ID. Reliability Growth Analyses can be conducted on any number of Assets.

This field is required and must be a character field. If the value in this field is blank, a blank Asset ID will be assigned to the data.

Cumulative Operating Time

The total amount of time that has passed since the piece of equipment or location was placed into service.

This field is required for an analysis based on cumulative operating time.

Downtime

The amount of time the piece of equipment or location is not in operation. You can use the date a piece of equipment or location is repaired or the day it returns to service to help estimate downtime. If this information is available, it can be used to make the analysis more accurate.

This field is optional for an analysis based on failure dates. Downtime is not used by analyses based on cumulative operating time.

Downtime Units

The downtime units.

This field is used only by analyses based on failure dates that are using downtime. This field must be in calendar time. By default, the time in this field is measured in days.

Failure Date

The date on which the piece of equipment or location failed. This data can have many different descriptions such as Out of Service Date, Shutdown Date, or Failure Date.

This field is required for an analysis based on failure dates and optional for an analysis based on cumulative operating time. For an analysis based on cumulative operating time:

  • All failures must have a failure date, or no dates will appear in the analysis.
  • Failure dates should be in the same order as cumulative operating time.

Installation Date

The date on which the piece of equipment or location was installed.

This field is optional.

Note: Providing Installation Date will improve the accuracy of the analysis.

Operating Time Units

The operating time units.

For an analysis based on failure dates, this field must be in calendar time.

For an analysis based on cumulative operating time, you can use custom time units, such as miles.

By default, the time in this field is measured in days.

Measurement Name

The type of the measurements you are collecting (e.g., failures, safety events, or cost). Throughout the documentation, we use the term measurement to represent the pieces of data that are being collected.

This value is required for all analyses.

Number of Failures

The number of failures or amount of data that is recorded at each measurement.

This field is optional. If no data is provided for this field, the GE Digital APM system will assume there is one failure for each datapoint. If you are using grouped data, this field is required.

Access Multiple Reliability Growth Analyses

About This Task

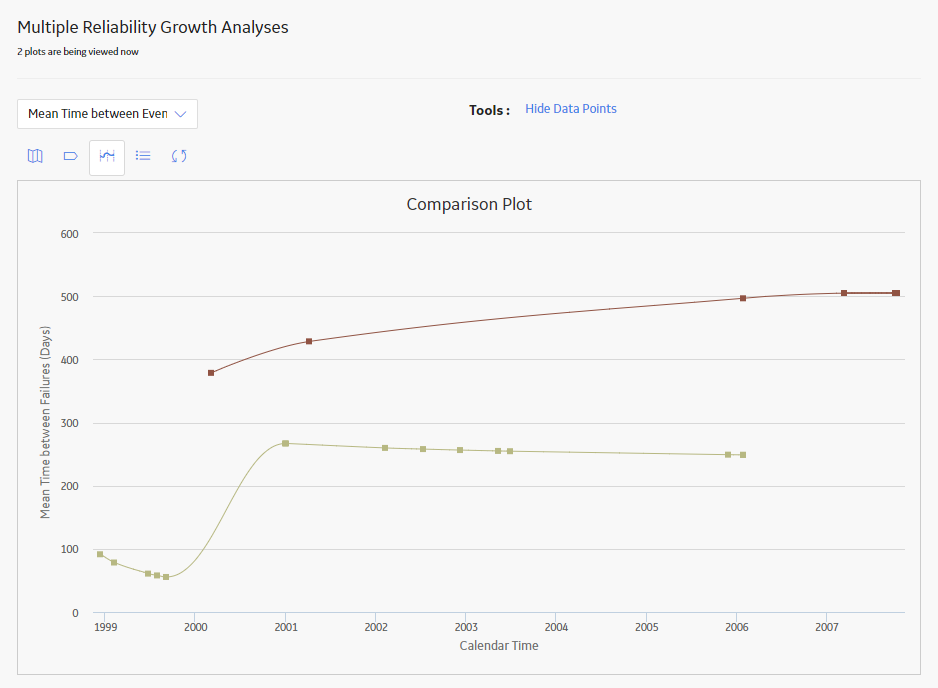
You can access multiple Reliability Growth Analyses and compare multiple plots for the selected analyses. You cannot modify the details of the analyses from which the Comparison Plot is generated.

Procedure

  1. Access the RA Overview page.
  2. Select the Reliability Growth tab.

    A list of Reliability Growth Analyses available in the database appears.


  3. Next to the Analysis ID, select two or more Reliability Growth Analyses whose plots you want to compare.
    Note: You can select up to 20 analyses to compare plots.
  4. In the upper-right corner of the grid, select .

    The Multiple Reliability Growth Analysis page appears, displaying the Comparison Plot. By default, Cumulative <Measurement> plot for the selected analyses appears. You can also view the following types of plots:


Create a Reliability Growth Analysis From Failure Dates Using an Existing Query or Dataset

About This Task

If you record event-based data, such as failure dates (e.g., a failure was recorded on 5/5/12), you can create a Reliability Growth Analysis using event-based data and data containing dates.

Note: A minimum of three failure datapoints are necessary to perform a calculation.

Procedure

  1. Access the RA Overview page .
  2. In the upper-right corner of the page, select New Analysis, and then select Reliability Growth.

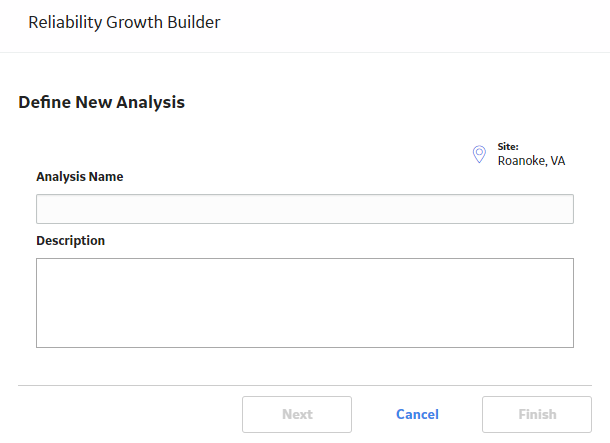
    The Reliability Growth Builder window appears.


    Note: All required information is provided, but for additional information, consult the Reliability Growth and Measurement Data topics.
  3. Enter values in the Analysis Name and Description boxes for the new analysis, and then select Next.

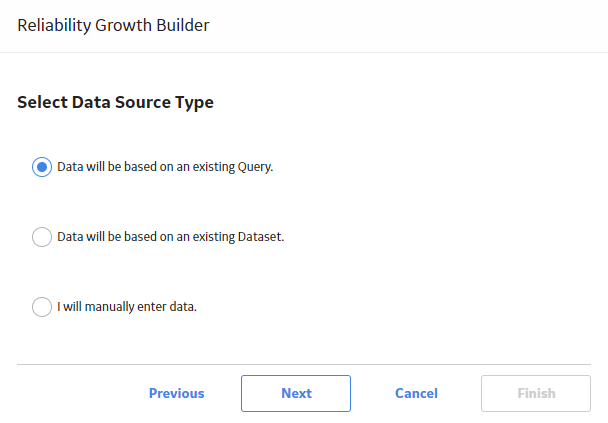
    The Select Data Source Type screen appears. The Data will be based on an existing Query is selected by default.


  4. If you want to load data using an existing query, select Data will be based on an existing Query, and then select Next.

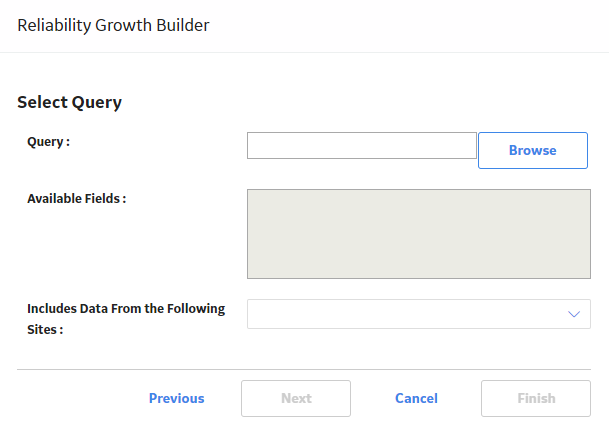
    The Select Query screen appears.


    -or-

    If you want to load data using an existing dataset, select Data will be based on an existing Dataset, and then select Next.

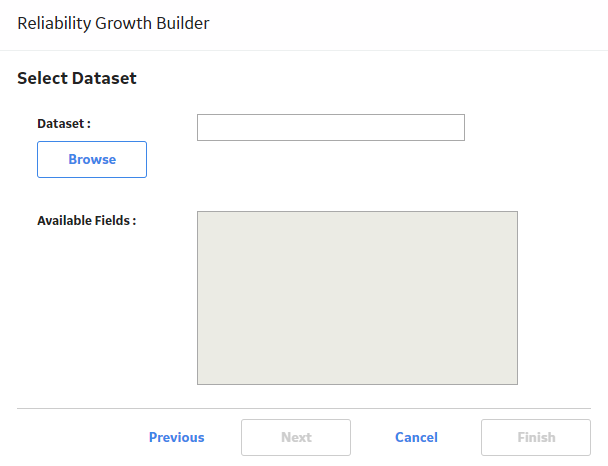
    The Select Dataset screen appears.


  5. Select Browse to search for an existing query or dataset in the GE Digital APM Catalog.

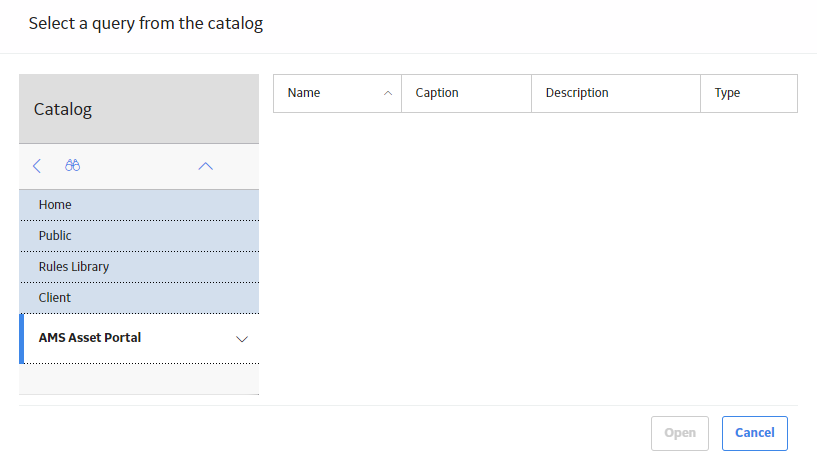
    The Query Browser or Dataset Browser screen appears, depending on whether you selected Data will be based on an existing Query or Data will be based on an existing Dataset in the previous step.

    The following image shows the screen to select a query:


  6. Select the needed query or dataset from the Catalog, and then select Open.

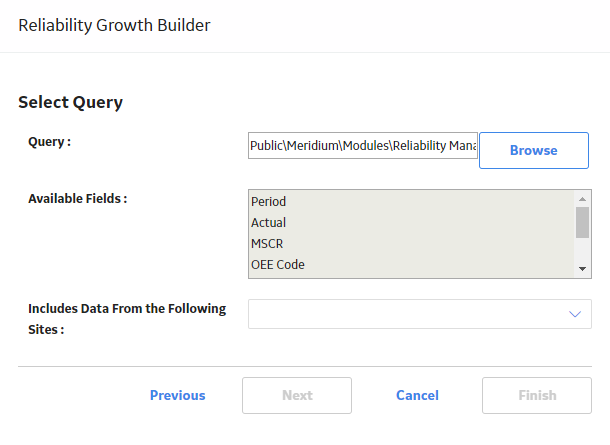
    The complete path to the query or dataset is displayed in the Query or Dataset box. The fields that exist for the selected query or dataset appear in the Available Fields list.

    The following image shows the path to a selected query and the fields in the Available Fields list:


  7. In the Includes Data From the Following Sites list, select the site(s) whose data from which you want to create an analysis.
    If you are creating an analysis in a database that has only one site stored in the Site Reference family, then the Includes Data From the Following Sites list will not appear on the Select Query screen.
  8. Select Next.

    The Select Data Format screen appears.


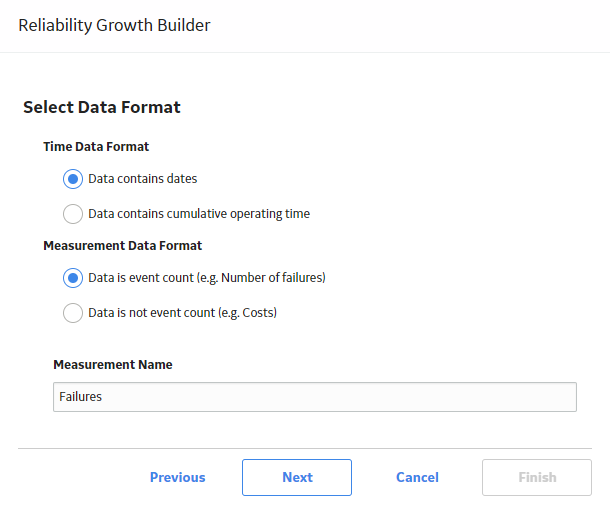
  9. On the Select Data Format screen, specify the following:
    • In the Time Data Format section, select Data contains dates. This option indicates the datasource with data that contains specific event dates (e.g., 5/5/2012).
    • In the Measurement Data Format section:

      If you want to use the datasource with data that contains event counts, such as number of equipment failures, safety incidents, or equipment repairs, select Data is event count (e.g. Number of failures).

      -or-

      If you want to use the datasource with data that does not contain event counts but contains an amount, such as cost or hours, select Data is not event count (e.g. Costs).

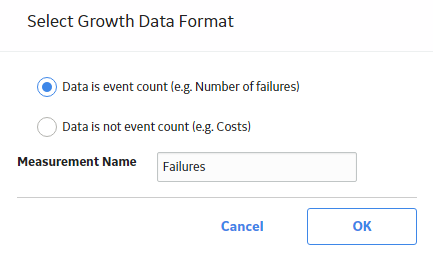
    • In the Measurement Name box, enter the name of the data you are measuring throughout the analysis (e.g., cost, events). This is a required field. By default, this value is Failures. The measurement name that you select will be displayed throughout the analysis results.
    Note: These instructions assume that you will select Data is event count, and leave the Measurement Name box with the default value Failures.
  10. Select Next.

    The Select Data Fields screen appears.


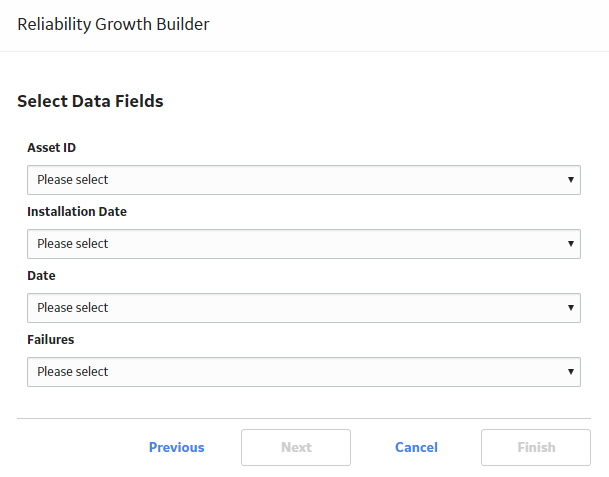
  11. Select the columns from your query or dataset that you want to map to the Reliability Growth Analysis. The available columns are:
    • Asset ID: Contains the IDs of the failed equipment or locations. You must select a column that contains alphanumeric values. This is a required field.
    • Installation Date: Contains the installation dates of the Assets. This field appears only for an analysis based on failure dates. This is an optional field.
    • Date: Contains the failure date of the equipment or locations. This is a required field.
    • Failures: Contains the number of failures recorded at each measurement. If you do not select a value from the list, the GE Digital APM system will assume that one failure exists for each datapoint. If the number of failures is 1, the calculation will be based on an event-terminated or time-terminated analysis. If the number of failures is more than 1, the calculation will be based on a grouped-data analysis.
  12. Select Next.

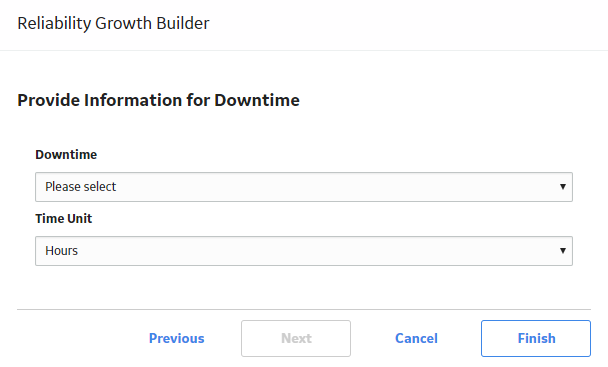
    The Provide Information for Downtime screen appears.


  13. In the Downtime list, select the query or dataset column that contains downtime values for the failed Assets (e.g., Total Time to Repair). This value is optional but must be numeric.
  14. In the Time Unit list, select the time units associated with the selected downtime from the following options:
    • Hours
    • Days
    • Weeks
    • Months
    • Quarters
    • Years

    The default value is Days.

  15. Select Finish.

    The GE Digital APM system generates the analysis and the Reliability Growth page appears, displaying the analysis results.


Create a Reliability Growth Analysis From Cumulative Operating Time Using an Existing Query or Dataset

About This Task

If you record event-based data using operating time instead of failure dates (e.g., a failure occurred after the piece of equipment was running for 10 days), then you can create a Reliability Growth Analysis using event-based data and cumulative operating time (COT).

Note: A minimum of three failure datapoints are necessary to perform a calculation.

Procedure

  1. Access the RA Overview page.
  2. In the upper-right corner of the page, select New Analysis, and then select Reliability Growth.

    The Reliability Growth Builder window appears.


    Note: All required information is provided, but for additional information, consult the Reliability Growth and Measurement Data topics.
  3. Enter values in the Analysis Name and Description boxes for the new analysis, and then select Next.

    The Select Data Source Type screen appears. The Data will be based on an existing Query is selected by default.


  4. If you want to load data using an existing query, select Next.

    The Select Query screen appears.


    -or-

    If you want to load data using an existing dataset, select Data will be based on an existing Dataset, and then select Next.

    The Select Dataset screen appears.


  5. Select Browse to search for an existing query or dataset in the GE Digital APM Catalog.

    The Query Browser or Dataset Browser screen appears, depending on whether you selected Data will be based on an existing Query or Data will be based on an existing Dataset in the previous step.

    The following image shows the screen to select a query:


  6. Select the needed query or dataset from the Catalog, and then select Open.

    The complete path to the query or dataset is displayed in the Query or Dataset box. The fields that exist for the selected query or dataset appear in the Available Fields list.

    The following image shows the path to a selected query and the fields in the Available Fields list:


  7. In the Includes Data From the Following Sites list, select the site(s) whose data from which you want to create an analysis.
    If you are creating an analysis in a database that has only one site stored in the Site Reference family, then the Includes Data From the Following Sites list will not appear on the Select Query screen.
  8. Select Next.

    The Select Data Format screen appears.


  9. On the Select Data Format screen, specify the following:
    • In the Time Data Format section, select Data contains cumulative operating time. This option indicates that the datasource contains data that contains operation time values (e.g., 10 days).
    • In the Measurement Data Format section:

      If you want to use the datasource with data that contains event counts, such as number of equipment failures, safety incidents, or equipment repairs, Data is event count (e.g. Number of failures).

      -or-

      If you want to use the datasource with data that does not contain event counts but contains an amount, such as cost or hours, select Data is not event count (e.g. Costs).

    • In the Measurement Name box, enter the name of the data you are measuring throughout the analysis (e.g., cost, events). This is a required field. By default, this value is Failures. The measurement name that you select will be displayed throughout the analysis results.
    Note: These instructions assume that you will select Data is event count (e.g. Number of failures) and leave the Measurement Name box with the default value Failures.
  10. Select Next.

    The Select Data Fields screen appears.


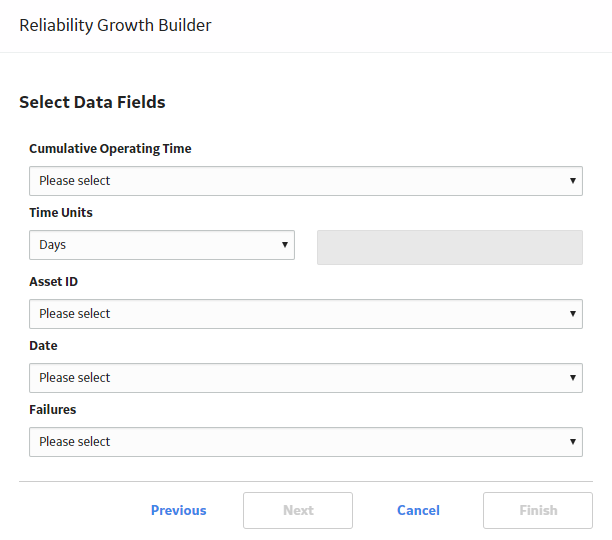
  11. Select the columns from your query or dataset that you want to map to the Reliability Growth Analysis. The available columns are:
    • Cumulative Operating Time: Contains the piece of equipment's or location's cumulative operating time, or the time that has passed since it was placed into service. This field appears only for an analysis based on cumulative operating time. This is a required field.
    • Time Units: Indicates the units for cumulative operating time from the following options: Hours, Days, Weeks, Months, Quarters, Years, or Custom. By default, Days is selected in the Time Units box. If you select Custom, the second box is enabled and you can specify any units of your choice (e.g., miles). This field appears only for an analysis based on cumulative operating time. This is a required field.
    • Asset ID: Contains the IDs of the failed Assets. This is an optional field.
    • Date: Contains the failure date of the Assets. This is an optional field, but if you do not select a field in this list, all labels in the Reliability Growth Analysis will display cumulative operating time only. This will result in allowing you to extrapolate based on time only, not date.
    • Failures: Select the query or dataset column that contains the number of failures recorded at each measurement. If you do not select a value in the list, the GE Digital APM system will assume that one failure exists for each datapoint. If the number of failures is 1, the calculation will be based on an event-terminated or time-terminated analysis. If the number of failures is more than 1, the calculation will be based on a grouped-data analysis.
  12. Select Next.

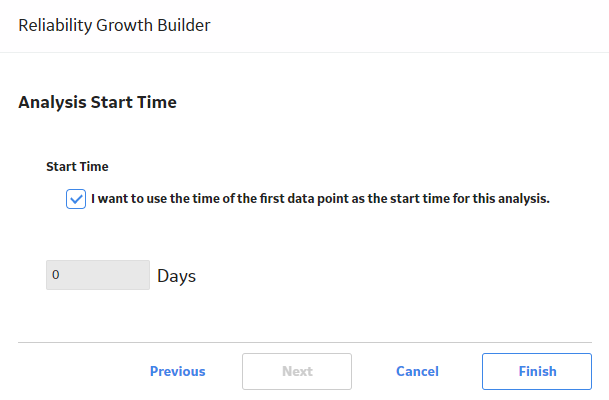
    The Analysis Start Time screen appears. The I want to use the time of the first data point as the start time for this analysis check box is selected by default.


  13. Specify the start time of the analysis.
    Note: If you did not select a field in the Date list on the Select Data Fields screen, the field is disabled. If you selected a field that did not contain a date in every row, a message will appear, stating that one or more failure dates are missing and that dates will not be estimated in the analysis.
  14. Select Finish.

    The GE Digital APM system generates the analysis and the Reliability Growth page appears, displaying the analysis results.


Create a Reliability Growth Analysis from Manually Entered Data

Procedure

  1. Access the RA Overview page.
  2. In the upper-right corner of the page, select New Analysis, and then select Reliability Growth.

    The Reliability Growth Builder window appears.


    Note: All required information is provided, but for additional information, consult the Reliability Growth and Measurement Data topics.
  3. Enter values in the Analysis Name and Description boxes for the new analysis, and then select Next.

    The Select Data Source Type screen appears. The Data will be based on an existing Query is selected by default.


  4. Select I will manually enter data, and then select Next.

    The Select Data Format screen appears.


  5. On the Select Data Format screen, specify the following:
    • In the Time Data Format section, select Data contains dates. This option indicates that the datasource will include data that contains specific event dates (e.g., 5/5/2012).
    • In the Measurement Data Format section:

      If you want to use the datasource with data that contains event counts, such as number of equipment failures, safety incidents, or equipment repairs, select Data is event count (e.g. Number of failures).

      -or-

      If you want to use the datasource with data that does not contain event counts but contains an amount, such as cost or hours, select Data is not event count (e.g. Costs).

    • In the Measurement Name box, enter the name of the data you are measuring throughout the analysis (e.g., cost, events). This is a required field. By default, this value is Failures. The measurement name that you select will be displayed throughout the analysis results.
  6. Select Finish.

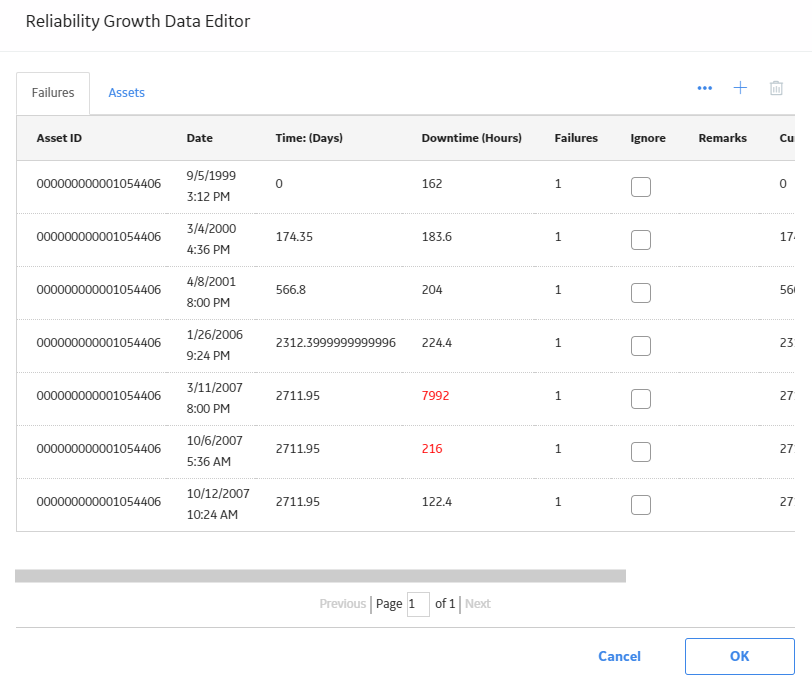
    The Reliability Growth Data Editor window appears. The Reliability Growth Data Editor window will look different depending on whether your analysis is using failure dates or cumulative operating time.


  7. Enter information about the Failures and Assets that you want to include in the analysis.

    A minimum of three failure datapoints are necessary to perform a calculation.

    Note: If you enter any downtime values that exceed the next failure date, the GE Digital APM system will highlight the downtime values on the Reliability Growth Data window. The cumulative time between failures will be calculated assuming that the downtime is not accurate and that the failure dates are accurate. When you close the Reliability Growth Data window, an error message will appear. The same error message will also appear in the Analysis Summary workspace.
    Tip: You can add more rows of data by selecting Add at the bottom of the Probability Distribution Data grid. You can remove any row of data by selecting Remove next to the row of data that you want to delete.
  8. Select OK.

    The Reliability Growth Data window closes. The GE Digital APM system generates the analysis and the Reliability Growth page appears, displaying the analysis results.


Modify the Analysis Period

Procedure

  1. Access a Reliability Growth Analysis for which you want to modify the analysis period.
  2. In the left pane, select the Cumulative <Measurement> Plot tab.

    The Cumulative <Measurement> Plot appears in the workspace.


    Note: You can also specify the analysis period for a plot via the Mean Time Between <Measurement> Plot, and <Measurement> Rate Plot tabs.
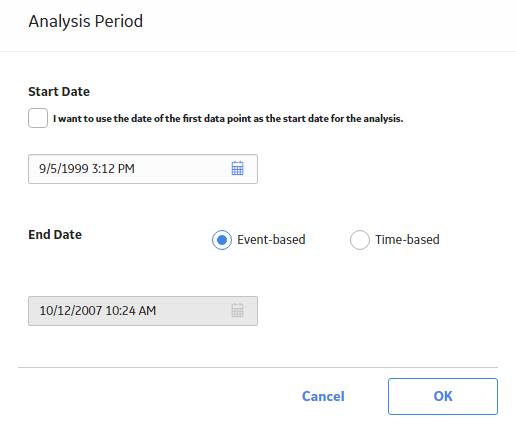
  3. In the upper-right corner of the workspace, select Growth Options, and then select Analysis Period.

    The Analysis Period window appears.


  4. If you want the start date to be the first datapoint, select the I want to use the first data point as the start date for this analysis check box. When this check box is selected, the corresponding date field is disabled automatically and displays the date on which the first event occurred.

    -or-

    If you want the start date to be different than the first datapoint, clear the I want to use the first data point as the start date for this analysis check box, and then enter or select the desired date and time.

    Note: To ensure that all failure dates appear on the plots, make sure the start date is before the date associated with of the first datapoint. Only failures that occur after the start date will appear on the plots.
  5. If you want the end date to correspond with the last event (i.e., datapoint) in the analysis, select Event-Based. When this option is selected, the date field below the I want to use today's date as the end date for the analysis check box is disabled automatically and displays the date on which the last event occurred.

    -or-

    If you want the end date to correspond with a certain time, select Time-Based. If you do not want today's date to be the end date, clear the I want to use today's date as the end date for this analysis check box, and then enter or select the desired date and time.

    Note: An Event-Based end time occurs when the last event and the end of the observation period (i.e., the end date) are the same. If some time has accumulated since the last event, this time is not included in the reliability model. If you want to include that time in the reliability model, you should select a Time-Based end time and enter the latest time in the observation period.
  6. Select OK.

    The GE Digital APM system recalculates the analysis using the dates that you selected for the analysis period.

    Note: If you have not included enough failures to calculate the results, a warning message will appear. A minimum of three failures must exist for each segment in the specified analysis period.

Rename a Reliability Growth Analysis

Procedure

  1. Access a Reliability Growth Analysis whose name you want to change.
  2. In the left pane, select the Cumulative <Measurement> Plot tab.

    The Cumulative <Measurement> Plot appears in the workspace.


    Note: You can also change the name of the analysis via the Mean Time Between <Measurement> Plot, and <Measurement> Rate Plot tabs.
  3. In the upper-right corner of the workspace, select Analysis Tasks, and then select Rename.

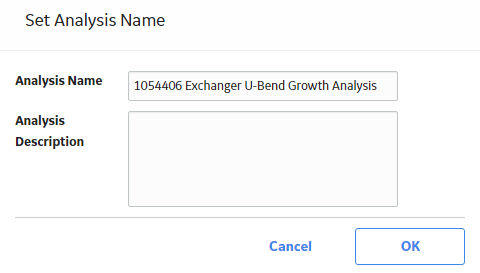
    The Set Analysis Name window appears.


  4. In the Analysis Name box, enter a new name for the analysis.
  5. In the Analysis Description box, enter a new description for the analysis.
  6. Select OK.

    The analysis name is updated in any appropriate sections on the summary page and in the site map to reflect the change. In addition, the Analysis Description field in any appropriate sections will reflect any changes.

Choose the Time Units for an Analysis

About This Task

The time units are used for expressing time values for calculations performed within an analysis. For example, a calculation may indicate the amount of time that lapsed between a failure event and the end date of the analysis period. This value would be expressed in the Time Units for the analysis.

Your Time Units selection will depend on what type of data you are using and what type of analysis you are performing. For example, in an analysis that shows the distribution of failures for a number of Assets over many years, years might be an appropriate unit of time. For an analysis designed to evaluate failures for a single Asset within a very specific time period, a smaller unit of time would be appropriate. For this reason, you can choose the Time Units that are most appropriate for a given analysis.

Procedure

  1. Access a Reliability Growth Analysis for which you want to modify the Time Units.
  2. In the left pane, select the Cumulative <Measurement> Plot tab.

    The Cumulative <Measurement> Plot appears in the workspace.


    Note: You can also modify the analysis period for a plot via the Mean Time Between <Measurement> Plot, and <Measurement> Rate Plot tabs.
  3. In the upper-right corner of the workspace, select Growth Options, and then select Time Units.

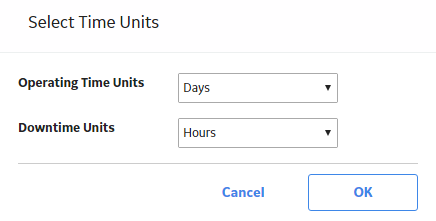
    The Select Time Units window appears.


  4. In the Operating Time Units list, select Hours, Days, Weeks, Months, Quarters, or Years. The default value is Days.
  5. In the Downtime Units list, select Hours, Days, Weeks, Months, Quarters, or Years. The default value is Days.
  6. Select OK.

    The GE Digital APM system automatically recalculates the analysis based on the new time units and displays the new units on the plot pages.

Specify the Data Format for a Reliability Growth Analysis

About This Task

When you create an analysis, you will choose whether or not your data is event-based and select the measurement name that will be used throughout the analysis via the Select Data Format screen in the Reliability Growth Builder. By default, the Measurement Name will be set to Failures.

Procedure

  1. Access a Reliability Growth Analysis for which you want to specify the data format.
  2. In the left pane, select the Cumulative <Measurement> Plot tab.

    The Cumulative <Measurement> Plot appears in the workspace.


    Note: You can also specify the data format for a plot via the Mean Time Between <Measurement> Plot, and <Measurement> Rate Plot tabs.
  3. In the upper-right corner of the workspace, select Growth Options, and then select Data Format.

    The Select Growth Data Format window appears.


  4. If the data that you are measuring is based on events, such as failures, safety incidents, or equipment repairs, select Data is event count.

    -or-

    if the data that you are measuring is not an event, but an amount, such as cost or hours, select Data is not event count.

  5. In the Measurement Name box, enter a value that corresponds with the type of data used in the analysis (e.g., cost, events). By default, this box contains the measurement value you entered on the Select Data Format screen in the Reliability Growth Builder when you created the analysis. If you modify this value, labels throughout the analysis will change automatically.
  6. Select OK.

    The Reliability Growth Analysis page appears, displaying the Reliability Growth Analysis with updated data or measurement labels.

Modify the Confidence Level for a Reliability Growth Analysis

Procedure

  1. Access the Reliability Growth Analysis for which you want to modify the confidence level.
  2. In the left pane, select the Cumulative <Measurement> Plot tab.

    The Cumulative <Measurement> Plot appears in the workspace.


    Note: You can also change the confidence level via the Mean Time Between <Measurement> Plot, and <Measurement> Rate Plot tabs.
  3. In the upper-right corner of the workspace, select Growth Options, and then select Confidence Level.

    The Select Confidence Level window appears.


    Note: If the Confidence Level box is disabled, select the Use Confidence check box to activate the confidence level and enable the Confidence Level box.
  4. In the Confidence Level box, select a value from the drop-down to represent the desired Confidence Level.
  5. Select OK.

    The GE Digital APM system displays the confidence intervals for the analysis based on the percentage you selected in the Confidence Level box.

Estimate Data in the Future

Procedure

  1. Access a Reliability Growth Analysis for which you want to estimate data in future.
  2. In the left pane, select the Cumulative <Measurement> Plot tab.

    The Cumulative <Measurement> Plot appears in the workspace.


    Note: You can also estimate data in future via the Mean Time Between <Measurement> Plot, and <Measurement> Rate Plot tabs.
  3. In the upper-right corner of the workspace, select Analysis Task, and then select Extrapolate.

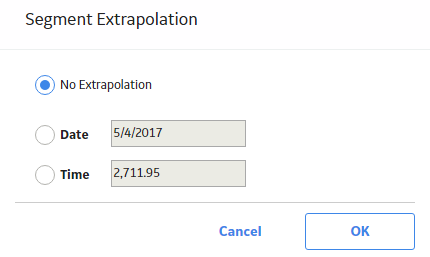
    The Segment Extrapolation window appears.


    Note: If you have not yet extrapolated the analysis, the No Extrapolation option is selected.
  4. If you want to estimate data by specific date, select Date, and then enter or select the date on which you want to know how many failures will have occurred.
    Note: You can extrapolate by date only if your analysis data contains dates. If the analysis does not contain dates, the Date option will not appear, and you will not be able to extrapolate based on dates.

    -or-

    If you want to estimate data by specific time, select Time, and then specify the number of time units at which you want to know how many failures will have occurred.

    Note: The date or time that you specify must be greater than the default date or time, which is the analysis end date or time.
  5. Select OK.

    The Cumulative <Measurement> Plot workspace appears, displaying the Cumulative <Measurement> plot with several lines added based on the extrapolation specification.

Split an Analysis Into Segments

About This Task

A Reliability Growth Analysis may, in some cases, indicate that your data is trending in an undesirable direction (e.g., failures are occurring very often, costs are too high). In these cases, you will probably decide to make significant adjustments to your work process to improve the results. You can create a Reliability Growth Analysis that is split into segments to represent periods of time before and after you made changes to improve the reliability of your equipment and locations.

When you generate a report for an analysis that has been split into segments, the report will contain information about each segment and the analysis as a whole.

Procedure

  1. Access the Reliability Growth Analysis that you want to split into segments.
  2. In the left pane, select the Cumulative <Measurement> Plot tab.

    The Cumulative <Measurement> Plot appears in the workspace.


    Note: You can also split an analysis into segments via the Mean Time Between <Measurement> Plot, and <Measurement> Rate Plot tabs.
  3. In the upper-right corner of the workspace, on the Cumulative <Measurement> Plot, select the datapoint that represents the last measurement recorded before you made a significant change to your work process.

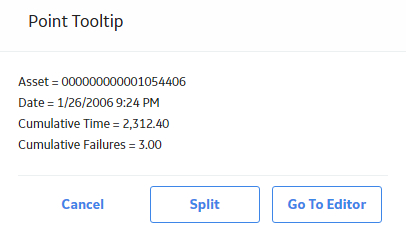
    The Point Tooltip window appears.


  4. Select Split.
    Note: The Split option is enabled only if there are at least three datapoints to the left and to the right of the datapoint you selected.

    The plot line bends at the datapoint you selected, representing two segments instead of one.

    Although the analysis still has an overall Initial and Final MTBF, each individual segment now also has its own Initial and Final MTBF. The AMSAA Reliability Growth Model page for an analysis based on event or an analysis not based on an event will also display different information for each segment. Each segment is colored according to whether it passed the GOF test. If the segment is blue, it passed the GOF Test. If the segment is orange, it failed the GOF test.

    Note: When you split the analysis manually via the Cumulative <Measurement> Plot tab, the MTBE Trend Plot and <Measurement> Rate Plot tabs will also reflect the split.

Merge Segments With Previous Segments

After you have split an analysis into multiple segments, you can merge the segments back into one segment.

Procedure

  1. Access the Reliability Growth Analysis for which you want to merge the segments.
  2. In the left pane, select Cumulative <Measurement> Plot.

    The Cumulative <Measurement> Plot appears in the workspace.


    Note: You can also merge the segments of an analysis via the Mean Time Between <Measurement> Plot, and <Measurement> Rate Plot tabs.
  3. In the upper-right corner of the workspace, on the Cumulative <Measurement> Plot, locate the segment that you want to merge.
  4. Click or tap on the segment.

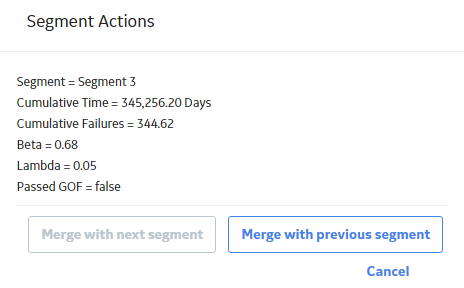
    The Segment Actions window appears.


  5. If you want to merge the selected segment with the previous segment, select Merge with previous segment.

    -or-

    If you want to merge the selected segment with the immediate next segment, select Merge with next segment.

    The segments are merged and a single plot line appears for the analysis.

    The AMSAA Reliability Growth Model page for an analysis based on event or an analysis not based on an event will also display different information for each segment.

    Note: When you merge the segments manually via the Cumulative <Measurement> Plot tab, the MTBE Trend Plot and <Measurement> Rate Plot tabs will also reflect the merge.

Access Reliability Growth Analysis Report

Procedure

  1. Access the Reliability Growth Analysis for which to you want view the report.
  2. In the upper-right corner of any workspace within the selected Reliability Growth Analysis, select the Report button.

    The Reliability Growth Analysis report appears in a new browser tab.

    By default, the report contains the following sections:

    • Analysis Plots
    • Analysis Summary
    • Growth Model Segments
    • Assets
    • <Measurement> Data

About Reliability Growth Analysis Reports

The baseline GE Digital APM database includes the Reliability Growth report, which you can use to view the summary of the results of a Reliability Growth Analysis.

The Reliability Growth Report is built from the following Catalog items:

  • The main report, GrowthAnalysisReport, which is stored in the Catalog folder \\Public\Meridium\Modules\Reliability Manager\Reports.
  • The subreport, AssetsubreportGrowth, which is stored in the Catalog folder \\Public\Meridium\Modules\Reliability Manager\Reports.
  • The subreport, FailuresubreportGrowth, which is stored in the Catalog folder \\Public\Meridium\Modules\Reliability Manager\Reports.
  • The supporting query that supplies data in the main report and subreports, GrowthAnalysisQuery, which is stored in the Catalog folder \\Public\Meridium\Modules\Reliability Manager\Reports.

Throughout this documentation, we refer to the main report, the subreports, and the supporting query collectively as the Reliability Growth report.

The Reliability Growth report contains a prompt on the ENTY_KEY field in the Reliability Growth family. When you run the Reliability Growth Report while viewing a Reliability Growth Analysis, the ENTY_KEY of the Reliability Growth record associated with the current analysis is passed automatically to the prompt, and the results for the current Reliability Growth Analysis are displayed. If you run the main report (i.e., GrowthAnalysisReport) or the supporting query (i.e., GrowthAnalysisQuery) directly from the Catalog, however, you will need to supply the ENTY_KEY of a Reliability Growth record manually to retrieve results. The subreports (i.e., Catalog items AssetsubreportGrowth and FailuresubreportGrowth) cannot be run directly from the Catalog.

Analysis Summary Section

The Analysis Summary section of the Reliability Growth Analysis report displays information that is stored in the Reliability Growth record and the Growth Model record that is linked to the Reliability Growth record. The Analysis Summary section will look different depending on whether or not your analysis data is event-based and the value you enter in the Measurement Name box. Also, the values in the Analysis Summary section will come from different fields in the Reliability Growth and Growth Model records, depending on whether the analysis is based on dates or cumulative operating time.

The following table lists each item in the Analysis Summary section for an analysis based on dates that contains event-based data and the corresponding Reliability Growth or Growth Model record field whose data is displayed in the report.

Report ItemReliability Growth or Growth Model record Record field
Analysis Name Reliability Growth Analysis ID
Analysis Description Reliability Growth Short Description
Analysis Start Reliability Growth

Analysis Start Date

Note: If the analysis is based on cumulative operating time, the report will used the value in the Analysis Start Time field.
Analysis End Reliability Growth

Analysis End Date

Note: If the analysis is based on cumulative operating time, the report will use the value in the Analysis End Time field.
Number of Assets Reliability Growth Assets
Total <Measurement>Growth Model Number of Failures
Time Units Reliability Growth Time Units
Observation Time

Growth Model

Reliability Growth

Total Observation Time

Time Units

Initial MTBF Reliability Growth

Initial MTBF

Time Units

Final MTBF Reliability Growth

Final MTBF

Time Units

Next Estimated Event Date Reliability Growth

TTNF

Time Units

Use Confidence Reliability Growth Use Confidence
Confidence Reliability Growth Confidence Level
Last Modified Reliability Growth LAST UPDT DT
Modified By Reliability Growth

LAST UPBY SEUS KEY

Note: The name of the Security User associated with this value is displayed in the report.

The Analysis Summary section for an analysis that is not event-based will appear mostly the same as the Analysis Summary section for an analysis that is event-based, with the following exceptions.

  • The Next Estimated Event Date field will not be displayed in the Analysis Summary section.
  • The Initial MTBF and Final MTBF fields will be labeled Initial <Measurement> Rate and Final <Measurement> Rate, respectively.
Note: Although the values used in the report are stored in Reliability Growth or Growth Model records, the report contains additional logic in order to display the values in this format. In other words, the values in the records are not in the exact form in which they appear in the report.

Growth Model Segments Section

The Growth Model Segments section of the Reliability Growth report displays information that is stored in the Reliability Growth record and the Growth Model record that is linked to the Reliability Growth record. The Growth Model Segments section will look different depending on whether the analysis is based on dates or cumulative operating time.

The following table lists each item in the Growth Model Segments section for an analysis based on dates and the corresponding Reliability Growth or Growth Model record field whose data is displayed in the report.

Report ItemReliability Growth or Growth Model record Record field
Segment Growth Model Sequence
Start Date Growth Model Model Start Date
End Date Reliability Growth Analysis End Date
Termination Type )


Reliability Growth

Is Grouped Data Time Terminated

Note:

If the value in the Is Grouped Data field is True, the Termination Type is Grouped-Data. If the value is False, the Termination Type depends on the value in the Time Terminated field.

If the value in the Time Terminated field is False, the Termination Type is Event-Based. If the value in this field is True, the Termination Type is Time-Based.

Beta Growth Model Beta
Lambda Growth Model Lambda
Statistic Growth Model GOF Statistic
Critical Value Growth Model

GOF P-Value

Passed Growth Model

Passed GOF

The Growth Model Segments section for an analysis that contains cumulative operating time will appear mostly the same as the Growth Model Segments section for an analysis that contains dates, with the following exceptions.

  • The Start Date and End Date fields will not be displayed in the Growth Model Segments section.
  • The Growth Model Segments section will display the following fields.

    Report ItemReliability Growth or Growth Model record Record field
    Start Time Reliability Growth Analysis Start Time
    End Time Reliability Growth Analysis End Time

Assets Section

The Assets section of the Reliability Growth report displays values that are stored in the Failures field in the Reliability Growth record. The Assets section will look different depending on whether the analysis is based on dates or cumulative operating time.

The following columns in the Assets section contain data that is stored in the Failures field in the Reliability Growth record:

  • Asset ID
  • Installation Date

    Note: The Installation Date column appears only for analyses based on dates.
  • Last Replacement

<Measurement> Data Section

The <Measurement> Data section of the Reliability Growth report displays information that is stored in the Failures field of the Reliability Growth record. The <Measurement> Data section will look different depending on whether the analysis is based on dates or cumulative operating time. It will also look different depending on the value you enter in the Measurement Name box.

The following columns in the <Measurement> Data section contain data that is stored in the Failures field in the Reliability Growth record:

  • Asset ID
  • Date
  • Time

    Note: The Time column appears only for analyses based on dates.
  • Downtime

    Note: The Downtime column appears only for analyses based on dates.
  • COT

    Note: The COT column appears only for analyses based on cumulative operating time.
  • <Measurement>
  • Ignore
  • Remarks
  • Cumulative Time

Plots Section

The Plots section of the Reliability Growth report displays the graphs that are accessed via the Reliability Growth page.

The Plots section contains the following graphs:
Delete a Reliability Growth Analysis

Procedure

  1. Access the RA Overview page.
  2. Select the Reliability Growth tab.

    A list of Reliability Growth Analyses available in the database appears.


  3. In the Analysis ID column, select the row containing the Reliability Growth Analysis that you want to delete, and then select .

    The Delete Reliability Growth Analysis dialog box appears, asking you to confirm that you want to delete the selected analysis.

  4. Select Yes.

    The selected analysis is deleted.