-
In the left pane, select the Logic Tree tab.
A blank datasheet appears.

-
Enter the following values:
| Field |
Value (s) |
| Event End Date
|
01/15/2018 |
| Event ID |
RCA-01/15/2018
Note: The Event ID field is populated automatically with the date the is created and is disabled so that value cannot be changed. If you choose to re-create this example RCA Event, your Event ID value will be different from the value listed here.
|
| Event Start Date
|
01/06/2018 |
| Label
|
Overheating in Pump 1
|
| Long Description
|
Investigate the cause of a cooling water pump to overheat and shut down the system.
|
-
Select .
The Failure Event node appears in the design canvas in the Logic Tree workspace.
- In the upper portion of the workspace, in the Palette section,
select
 , and then use the drag-and-drop method to add the icon to the Failure Event
node in the design canvas.
, and then use the drag-and-drop method to add the icon to the Failure Event
node in the design canvas.
-
Select the Failure Mode that you added.
The Properties window appears.
-
Enter the following information to define the Failure Mode, and then select :
| RCA Failure Mode ID
|
Value
(s) |
| No Spare Parts
|
Label: No Spare Parts
Description: No spare parts caused the pump to be out of commission for a longer amount of time.
|
-
Add another Failure Mode using the following information:
| RCA Failure Mode ID
|
Value
(s) |
| Motor tripped due to high temperature.
|
Label: Motor tripped due to high temperature.
Description: The motor shut off because the temperature became too hot and the system was shut down.
|
-
Diagram the events that led up to and immediately followed the failure event. For this example, you would create the Event Diagram as shown in the following image. The team should note the trend in the failures that occurred in the past. In this way, the team may be able to identify a pattern in the events prior to the RCA that may indicate the underlying cause(s) for these failures.
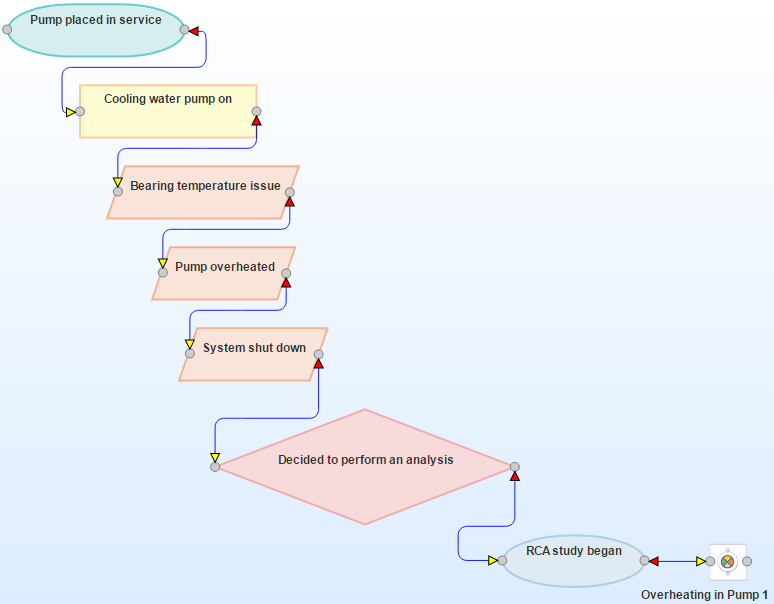
This example
contains nine RCA Sequence Nodes, which are displayed on the Event Diagram.
Sequence Nodes in Event Diagram
For each RCA Sequence Node, the following table lists the type
of node and the values that exist in the RCA Sequence Node.
|
Type
of Node
|
Values
|
|
Start/Finish
|
Label: Pump place into service
Event Start Date: 1/1/2014 12:00 AM
Event End Date:
1/1/2014 12:00 AM
|
|
Process
|
Label: Cooling water pump turned on daily
Event Start Date:
1/1/2014 12:00 AM
Event End Date:
1/6/2015 12:00 AM
|
|
Operation
|
Label: Bearing Temperature Alarm sounded
Event Start Date:
1/6/2015 12:00 AM
Event End Date:
1/6/2015 12:00 AM
|
|
Operation
|
Label: Pump Overheated
Event Start Date:
1/6/2015 12:00 AM
Event End Date:
1/6/2015 12:00 AM
|
|
Operation
|
Label: System shut down
Event Start Date: 1/6/2015 12:00 AM
Event End Date: 1/6/2015 12:00 AM
|
|
Decision
|
Label: Decided to perform an analysis
Event Start Date: 1/6/2015 12:00 AM
Event End Date: 1/6/2015 12:00 AM
|
|
Start/Finish
|
Label: RCA Study began
Event Start Date: 1/6/2015 12:00 AM
Event End Date: 1/16/2015 12:00 AM
|
- At the top of the workspace,
in the Palette section,
select
 above the design canvas, and then use the drag-and-drop method to add the icon to the Hypothesis in the design canvas.
-
Select the Hypothesis that you added.
The Properties window appears.
-
Enter the following information to define each of the Hypotheses required for our example.
| RCA Hypothesis ID
|
Value (s) |
| Mechanical
|
Label: Mechanical
Descriptions: The increase in temperature was due to a mechanical failure.
Confidence Factor: Likely (3)
State: Hypothesis True
|
| Electrical
|
Label: Electrical
Descriptions: The increase in temperature was due to an electrical failure.
Confidence Factor: Possibly True (2)
State: Hypothesis Not True
|
| Outboard bearing |
Label: Outboard bearing
Descriptions: The outboard bearing had a mechanical problem.
Confidence Factor: Highly Likely (4)
State: Hypothesis True
|
| Inboard bearing |
Label: Inboard bearing
Descriptions: The inboard bearing had a mechanical problem.
Confidence Factor: Somewhat True (1)
State: Hypothesis Not True
|
| Erosion
|
Label: Erosion
Descriptions: The outboard bearing eroded after overuse.
Confidence Factor: Somewhat True (1)
State: Hypothesis Not True
|
| Corrosion
|
Label: Corrosion
Descriptions: The outboard bearing corroded and was rusty.
Confidence Factor: Somewhat True (1)
State: Hypothesis Not True
|
| Fatigue
|
Label: Fatigue
Descriptions: The outboard bearing was overheated due to a weakness of materials.
Confidence Factor: Highly Likely (4)
State: Hypothesis Not True
|
| Misalignment
|
Label: Misalignment
Descriptions: The outboard bearing was not aligned correctly.
Confidence Factor: Possibly True (2)
State: Hypothesis Not True
|
| Loose Bolts
|
Label: Loose Bolts
Descriptions: Bolts were loose and caused the outboard bearing to become loose.
Confidence Factor: Possibly True (2)
State: Hypothesis Not True
|
| Lubrication Issue |
Label: Lubrication Issue
Descriptions: The outboard bearing was not receiving the right amount of lubrication.
Confidence Factor: Highly Likely (4)
State: Cause Physical
|
| Leak
|
Label: Leak
Descriptions: The lubricant was leaking from the pump.
Confidence Factor: Possibly True (2)
State: Hypothesis Not True
|
| Too Much Applied |
Label: Too much applied
Descriptions: There was too much lubricant, causing, the bearing to operate too quickly and overheat.
Confidence Factor: Possibly True (2)
State: Hypothesis Not True
|
| Too Little Applied
|
Label: Too little applied
Descriptions: There was not enough lubricant, causing friction and an increase in temperature.
Confidence Factor: Likely (3)
State: Cause Human
|
| Poor Training
|
Label: Poor training
Descriptions: Workers were not properly training on applying lubricant to the bearing.
Confidence Factor: Possibly True (2)
State: Hypothesis Not True
|
| Inadequate Procedures Documented
|
Label: Inadequate Procedures Documented
Descriptions: Workers are referencing procedure documentation that is not clear.
Confidence Factor: Possibly True (2)
State: Hypothesis Not True
|
| Worker Fatigue
|
Label: Worker Fatigue
Descriptions: Workers are overworked and are not able to perform at an acceptable level.
Confidence Factor: Likely (3)
State: Cause Physical
|
| Inadequate Accountability of Workers
|
Label: Inadequate Accountability of Workers
Descriptions: Workers are not being held accountable for the maintenance procedures they are required to perform.
Confidence Factor: Highly Likely (4)
State: Cause Latent
|
Diagram each failure mode in detail. For this example, you would create a Logic Tree like the one shown in the following image:

In the Logic Tree in this image, you can see that two Failure Mode nodes are linked to the Failure Event node, and multiple Hypothesis nodes are linked to the Motor Tripped due to high temperature Failure Mode node.
This example
contains four RCA Logic Gates, which represent Logic
Gate nodes and are used in the Logic
Tree. You must enable Logic Gates to view them on the Logic Tree.
Example Data in Logic Gates
In the following table, the Logic Gates are numbered as they appear
in the Logic Tree from left to right. For each RCA Logic Gate,
the table displays the value in the Gate Type field of the RCA Logic Gate and identifying information about the node (e.g., RCA Failure
Mode) to which it is linked.
|
RCA
Logic Gate
|
Value
Specified
|
Linked
To
|
|
1
|
Gate Type: OR
|
RCA Failure Mode: Motor tripped due to high temperature
RCA Hypothesis: Mechanical
RCA Hypothesis: Electrical
|
|
2
|
Gate Type:OR
|
RCA Failure Mode: Motor tripped due to high temperature
RCA Hypothesis: Mechanical
RCA Hypothesis: Inboard bearing
RCA Hypothesis: Outboard bearing
|
|
3
|
Gate Type:OR
|
RCA Failure Mode: Motor tripped due to high temperature
RCA Hypothesis: Outboard bearing
RCA Hypothesis: Corrosion
RCA Hypothesis: Erosion
RCA Hypothesis: Fatigue
|
|
4
|
Gate Type:OR
|
RCA Failure Mode: Motor tripped due to high temperature
RCA Hypothesis: Fatigue
RCA Hypothesis: Loose Bolts
RCA Hypothesis: Lubrication Issue
RCA Hypothesis: Misalignment
|
|
5
|
Gate Type:OR
|
RCA Failure Mode: Motor tripped due to high temperature
RCA Hypothesis: Lubrication Issue
RCA Hypothesis: Leak
RCA Hypothesis: Too Little Applied
RCA Hypothesis: Too Much Applied
|
|
6
|
Gate Type:OR
|
RCA Failure Mode: Motor tripped due to high temperature
RCA Hypothesis: Too Little Applied
RCA Hypothesis: Inadequate Accountability of Workers
RCA Hypothesis: Inadequate Procedures Documented
RCA Hypothesis: Poor Training
RCA Hypothesis: Worker Fatigue
|
Now that several likely hypotheses have been introduced, the team will need to rule out hypotheses. To rule out a hypothesis or prove a hypothesis, the hypothesis will need to be tested against the data that is available to the team (i.e., the failure event data and the team of experts).
As described in the next step, the Principal Analyst should create RCA Verifications and assign them to team members who will be responsible for completing the associated task.
- Select the Hypothesis that you want to verify.
-
In the lower-left corner of the workspace, select the Verifications tab.
The Verifications pane appears.
-
Above the list, select .
The Create Verification pane appears.

-
In the Assigned to list, select the team member to whom you want to assign the Verification.
A blank datasheet appears.

-
Enter the details in the available fields based on the following information to define each of the Verification required for our example, and then select .
|
RCA Verification ID
|
Values Specified
|
| Inspect wiring to
make sure that the cause was not electrical. |
Due Date: 1/10/2015
Method:
Inspect wiring to make sure that the cause was not electrical.
Completed: No
|
| Perform a metallurgical analysis to
determine why the bearing failed. |
Due Date: 1/10/2015
Method:
Perform a metallurgical analysis to determine why the bearing
failed.
Completed: False
|
The following image shows an example of an RCA Verification that contains a task to test the Mechanical hypothesis.

The task defined in this RCA Verification instructs the team member to inspect the wiring for the cooling water pump to ensure that the problem was not electrical, but mechanical.
When a hypothesis has been tested, you must change the state of the associated RCA Hypothesis, as described in the next step.
- Select the Hypothesis whose state you want to change.
- At the top of the workspace, in the States panel, select one of the following options, and then select :
For example, the following image shows the Logic Tree after Pete Handy has completed the RCA Verification to which he was assigned. Pete Handy concluded that the wiring did not the cause the pump to overheat, so the problem must be mechanical.

After the state of the Mechanical RCA Hypothesis is set to True, the team can continue down the Logic Tree until they identify the root cause. Causes can be further identified as physical, human, or latent. For example, the following image shows the Logic Tree after ALL the RCA Verifications have been completed. The team has concluded that inadequate accountability of workers has led to insufficient lubricant being applied to the outboard bearing, which caused the motor's temperature to increase and the pump to overheat.
In this case, the root cause for the pump failure would be identified as latent (i.e., inadequate accountability of workers), which lead to human (i.e., too little applied) and physical (i.e., lubrication issue) causes. Now that a hypothesis has been verified and the root cause has been determined, you can create RCA Recommendations to communicate your findings on how to prevent this failure in the future.
If the hypothesis is not true but you cannot rule out the hypothesis and set the state to False, you can assign a probability to the hypothesis to include the team in determining the possibility of the hypothetical cause.


