A Threshold Statistics node is a Calculation node that you can use in a policy model to determine the frequency and duration over which input values cross a defined threshold (i.e., meet a defined condition).
The input for a Threshold Statistics node must be a collectionA set of results from a Query node or a set of readings associated with input nodes such as Measurement Location, Health Indicator, or OPC Tag. with columns containing timestamps and numeric values. A Threshold Statistics node generates the following outputs:
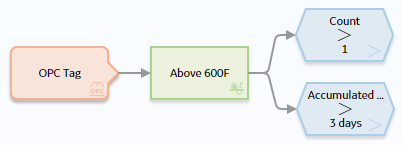
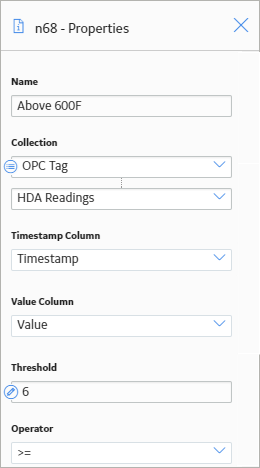
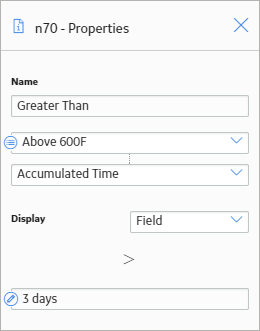
The Properties window for a Threshold Statistics node contains the items that are described in the following table.
Item |
Description |
Notes |
---|---|---|
Collection section |
Specifies the collection for which you want to calculate a threshold statistic. |
You can select |
Timestamp Column list |
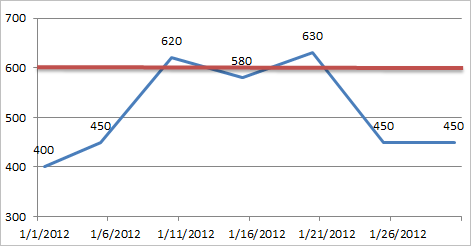
Specifies the column that contains the timestamps that you want to use to calculate the accumulated time during which the input values cross the defined threshold. |
This list contains the columns that are available in the selected collection. |
Value Column list |
Specifies the column that contains the input values that will be compared to the threshold value. |
This list contains the columns that are available in the selected collection. |
Threshold section |
Specifies the threshold value that will be compared to the values that are defined in the Value Column list. |
You can select |
Operator list |
Specifies the comparison operator that will be used to compare inputs values to the threshold value. |
This list contains the following operators:
|
The following example illustrates how you can use a Threshold Statistics node with Condition nodes to evaluate how many times and for how long reading values exceeded a defined threshold. Consider the following nodes and connections.
In this model, the Temperature OPC Tag node is connected to the Above 600 F Threshold Statistics node, which is also connected to two Greater Than nodes.
As shown in the following image, you can use the Properties window for the Threshold Statistics node to:
As shown in the following image, you can use the Properties window for the Count > 1Greater Than node to select the input Count from the Threshold Statistics node.
As shown in the following image, you can use the Properties window for the Accumulated Time > 3 Days Greater Than node to select the input Accumulated Timefrom the Threshold Statistics node.
When these options are selected, the condition nodes evaluate the number of times and amount of time, respectively, over which the reading values recorded in the process historian exceeded the threshold of 600 degrees Fahrenheit.
More about this example
To further explain this example, consider the following graph, where:
In the graph, you can see that the process historian recorded a reading value above 600 two times, where one value was 620 (on 1/10) and the other value was 630 (on 1/20). These values are treated as two separate occurrences of exceeding the threshold value because the reading value actually dropped below 600 between those two dates. In this scenario, the condition Count > 1 would be true, but the condition Accumulated Time > 3 Days would be false.
Now consider the following graph in which the value recorded on 1/15/2012 was also above 600. In this scenario, the GE Digital APM system determines that the threshold value was exceeded only one time, not three times. Specifically, whenever a reading value exceeds the threshold value, if the threshold value continues to be exceeded with each subsequent reading value, the GE Digital APM system treats it as one occurrence of exceeding the threshold. Whenever a subsequent reading value drops below the threshold value, the next time another reading value exceeds it again, the GE Digital APM system treats that as a separate occurrence.
Here, you can see that the first reading value that exceeded the threshold value is 620. After that, two consecutive reading values also exceeded the threshold: 625 and 630. These additional reading values, however, are not treated as a second occurrence of exceeding the threshold value because they are consecutive. Therefore, the condition Count > 1 would be false and the condition Accumulated Time > 3 Days would be true.
Copyright © 2018 General Electric Company. All rights reserved.