On the left navigation menu, select Reliability, and then select Generation Availability Analysis.
Note: You can also access Generation Availability Analysis information associated with a functional location and its children. To do so:
-
In the upper-left corner of the top navigation bar, select
. The Asset page appears.
-
In the left pane, navigate to the function location for which you want to access the GAA Overview page.
-
In the workspace, select the Reliability tab.
A list of types of performance related analyses performed on the selected functional location appears.
- Select the hyperlink for Generation Availability Analysis that specifies the number of Events Under Review, Approved Events, and Generation Reports generated for the selected functional location.
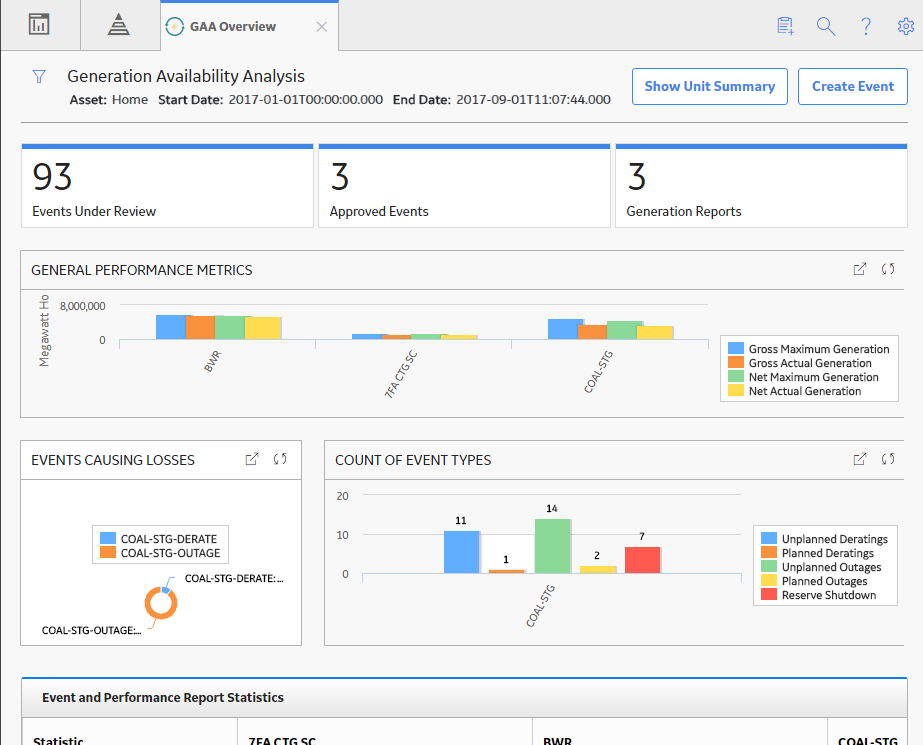
The GAA Overview page appears, displaying the following information related to each GAA Unit for the specified period:
- The Events Under Review section: Contains a list of Events that are being reviewed. The section contains the following columns of information:
- Event ID: Contains the value from the Event ID field. You can select the link in the Event ID column to access the selected event.
- Unit Name: Contains the value that you entered in Unit Name field to identify the GAA Unit to which the event occurred. You can select the link in the Unit Name column to access the Unit Summary workspace for the selected GAA Unit.
- Event Type: Contains the value that you entered in Capacity Event Type field to identify the type of event.
- Event Description: Contains the value that you entered in Capacity Event Type field to describe the event.
- Start Date: Contains the value that you entered in the Event Start field to indicate the date and time that the event started.
- End Date: Contains the value that you entered in the Event End field to indicate the date and time that the event ended.
- The Approved Events section: Contains a list of Events that have been approved. The section contains the same columns of information as the Events Under Review tab.
-
The Generation Reports section: Contains a list of regulatory and management (SSRS) reports and links to generate management reports. The section contains the following columns of information:
- Report ID: Contains the value that identifies the report.
- Unit ID: Contains the value that identifies the GAA Unit.
- Modified By: Contains the value that identifies the user who modified the reports.
- Last Modified: Contains the time when the report was last modified.
You can manage the Regulatory reports using the Manage Reports button.
- The General Performance Metrics graph section: Contains a bar graph that shows the actual and maximum productivity of each GAA Unit for the specified period. The graph plots the following fields:
- Gross Maximum Generation (MWh)
- Gross Actual Generation (MWh)
- Net Maximum Generation (MWh)
- Net Actual Generation (MWh)
-
The Events Causing Losses graph section: Contains a doughnut graph that shows the sum of losses of each of the following type for each GAA Unit for the specified period:
- Outages (MWH loss)
- Derates (MWH loss)
- Reserve Shutdown (MWH loss)
-
The Count of Event Types graph section: Contains a bar graph that shows the number of following types of events for each GAA Unit during the specified time:
- Unplanned Outages
- Planned Outages
- Reserve Shutdown
The x-axis shows the name of each GAA Unit and y-axis shows the number of events that occurred at each of the GAA Unit.
The colors that represent various fields in this graph appear based on the color that you specify when adding an Event Category. You must then, modify the colors of the graph for each of the Event Categories.
When you select a bar in the graph, the Unit Summary workspace for the associated GAA Unit appears in a new tab.
-
The Event and Performance Report Statistics section: Contains a grid that displays the values from all the fields available on the Detailed Loss Net MWh tab on the Performance datasheet for each GAA Unit for the specified period.

The y-axis shows the number of Megawatt Hours for each GAA Unit.
When you select a bar in the graph, the Unit Summary workspace for the associated GAA Unit appears in a new tab.
While viewing any of the above charts, you can select