When you run a Monte Carlo simulation, the GE Digital APM system analyzes statistics about cost, performance, and reliability from the iterations of the Scenarios to calculate the simulation results.
The data is presented in the Analysis Summary workspace and the Asset Strategy Optimization Simulation Results workspace for the selected Asset Strategy.
The ASO Simulation Results workspace displays the following information:
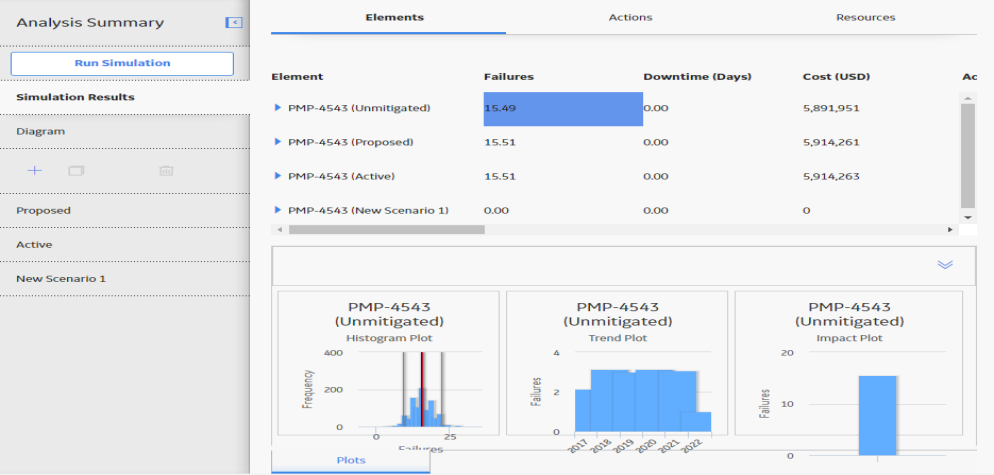
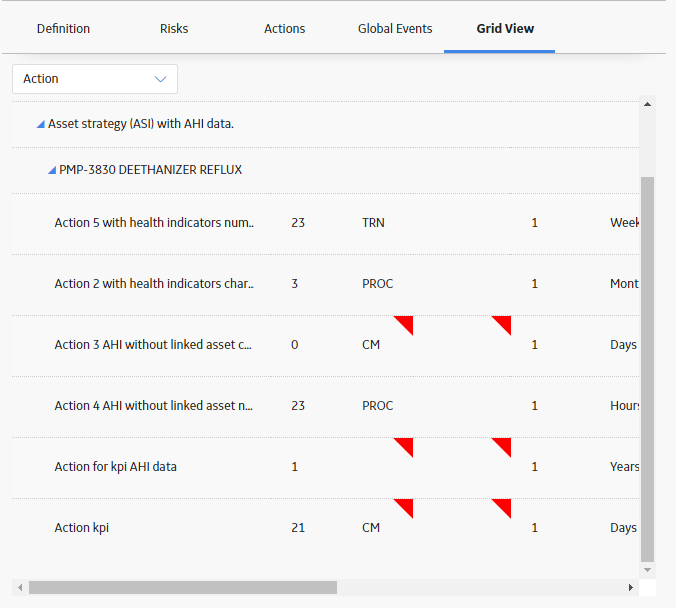
This section displays specific results for the elements that exist in the simulation. The following columns of information are displayed in the grid:
Element: Displays a hierarchy that lists the components in the simulation.
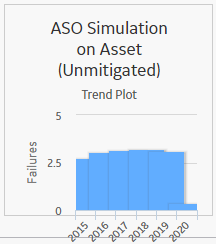
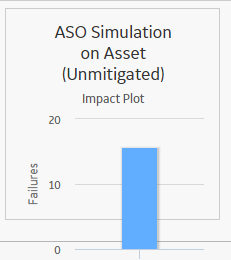
Failures: The average number of times the selected item failed during the analysis period for all iterations of the Scenario to which it belongs.
Downtime (Days): The average number of days that the selected item was out of service due to failures or shutdowns for all iterations of the Scenario to which it belongs.
Cost ($): The average total cost of the selected item for all iterations of the Scenario to which it belongs. This includes the cost of any items that belongs to the item, lost production costs, fixed costs, variable costs, action costs, planned or unplanned correction costs, and Resource costs.
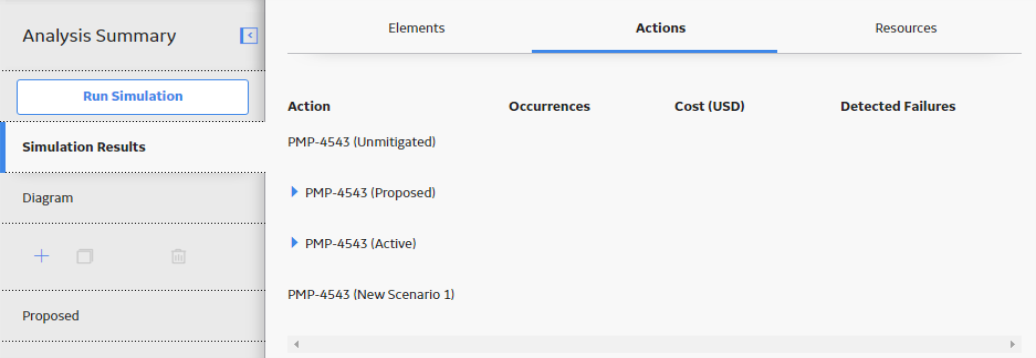
Availability (%): The average percentage of the time that the selected item was available and running for the Scenario to which it belongs.
Next Failure (Days): The average amount of time, in days, from the analysis Start Date until the next failure occurs for the selected item.
This section displays specific results for each action that exists in the simulation. The following columns of information are displayed in the grid:
Detected Failures: The average number of potential failures detected in advance by the action. This result is calculated only for inspection and condition monitoring actions, which are the only actions that can detect potential failures.
This section displays specific results for each Resource that exists in a System Reliability Analysis. The following columns of information are displayed in the grid:
Occurrences: The average number of times the Resource is used during the simulation period.
Note: For System Resource records in which the Count Occurrences field is set to False, the value in this column will be 0 (zero).
Unplanned Correction Resource Cost (USD): The resource cost incurred while conducting unplanned maintenance.
By selecting a cell in any of these three sections, you can view more detailed information in the following graphs:
While the grids in the Simulation Results workspace display average values, it can be helpful to understand the specific values that were used to calculate the averages. The Histogram Plot shows the distribution of the actual values from all iterations that were used to calculate the average value.
The distribution of the actual values spreads across a series of data ranges, which are called bins and are represented by columns on the Histogram Plot. When an actual value from an iteration falls into a bin, it is included in the associated column. The higher the column is in the chart, the more values have fallen into the bin.
Note: The number of columns that appear in the Histogram Plot is determined by the value in the Histogram Bins field in the root System Analysis record.
Additional values are represented by the following lines in the Histogram Plot:
Optimistic Value: Leftmost gray vertical line in the Histogram Plot. This line represents the lower level of the confidence interval.
Realistic Value: Blue line in the Histogram Plot. This line represents the median value, which is the median value of the values from the iterations of the Scenario.
Note: If the median value falls in between two values, then the larger value will be used as the Realistic value.
Pessimistic Value: Rightmost gray vertical line in the Histogram Plot. This line represents the upper level of the confidence interval.
While the grids in the Simulation Results workspace display average values, understanding the specific values that make up the average can be helpful as well. The Trend Plot shows the average value for each analysis time interval, as defined by the value in the Time Analysis Type field in the root System Analysis record. If the Time Analysis Type field is set to:
Monthly: The Cost Trend Plot will display the Cost Trend for each month in the simulation period.
While the grids in the Simulation Results workspace display average values, understanding the values that make up the average can be helpful as well. The Impact Plot shows how the average failure value is calculated as a total of the individual Risk failure averages.
Note: This plot is not shown for the Reliability column in the Elements, Actions, or Resources section.
IMPORTANT: If the analysis does not have complete, valid information for the simulation, a message will appear, indicating that the information in the simulation needs to be corrected. The incorrect fields will be highlighted in red until the simulation has been corrected and saved.
When the optimization process is initiated from ASM, the contents of the Asset Strategy are transferred to the ASO module and the strategy in ASM is placed in Simulation mode. An Active scenario and a proposed scenario are then created in ASO.
The purpose of the Active scenario is to retain a visible record of the source strategy in ASO, for comparison purposes, while the proposed scenario provides a copy to be modeled under various proposed changes, the results of which will be shown in the simulation results, and in ASM.
When changes are made to the source strategy in ASM or to the proposed scenario in ASO, these are not immediately reflected in the linked module, i.e., synchronization is not automatic. The contents of the two modules are synchronized each time a Monte Carlo simulation is run.
When a simulation run is initiated all scenarios (Active, Proposed and copies) are subjected to Monte Carlo simulation, for which valid simulation data will need to be added via the scenario grids. If insufficient or invalid data is preventing simulation from running the user is taken to each scenario in turn to complete the necessary data, with mandatory entries being indicated by a red icon and a count showing on the scenario tab in the left navigation pane.
When the simulation run has been completed the contents of the proposed scenario are reflected in ASM, which is placed in a modified state. If initial synchronization, based on the proposed scenario in ASO, has not taken place, or the proposed scenario has been modified in ASO since the last simulation run, the user will not be permitted to make changes to the source strategy in ASM via Risk Analysis. Here the user will be notified on Risk Analysis and Review Strategy pages of the need to rerun the simulation and a hyperlink provided on these pages to initiate the Simulation run.
Note: The above restrictions on modifying a strategy in ASM do not apply to the Risk and Actions pages. Any additions or modifications to actions and Risks will be captured in the Active and Proposed scenarios in ASO when the user selects Run Simulation in ASM. It is important that the hyperlink provided in the Risk Analysis and Review Strategy pages in ASM is used at this point since changes in ASM will not be captured if the Simulation is run from ASO. If the user chooses to run the Simulation from ASO the modified strategy will be overwritten with the simulation results from the proposed scenario before these changes had been captured and run in the ASO Analysis.
Copyright © 2018 General Electric Company. All rights reserved.