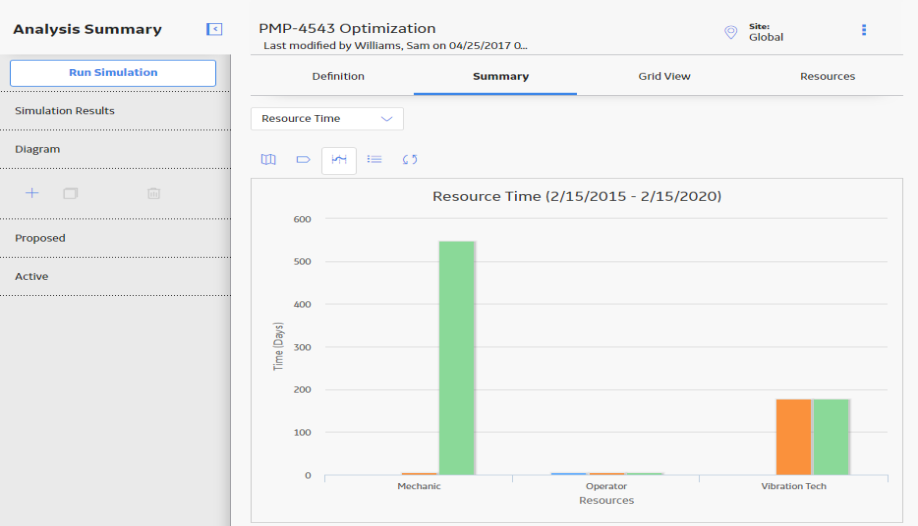
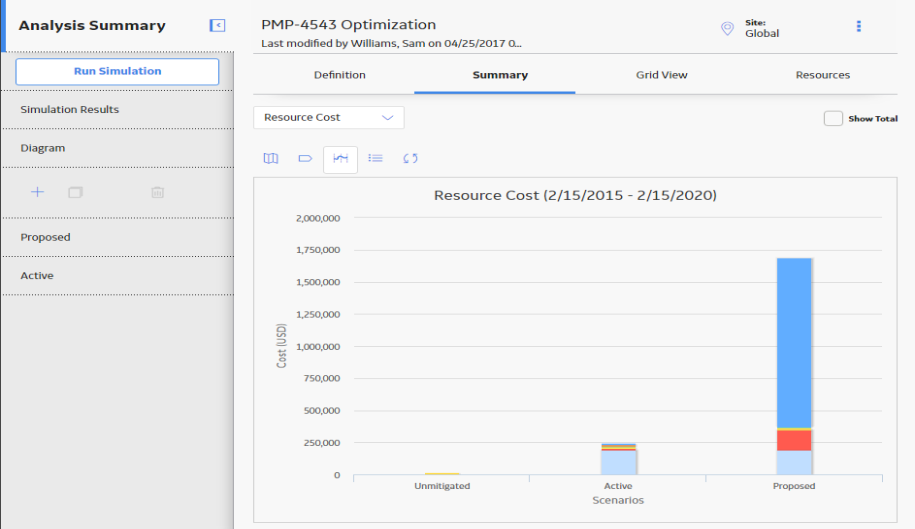
When you run a Monte Carlo simulation, the GE Digital APM system analyzes statistics about cost, performance, and reliability from the iterations of the Scenarios to calculate the simulation results.
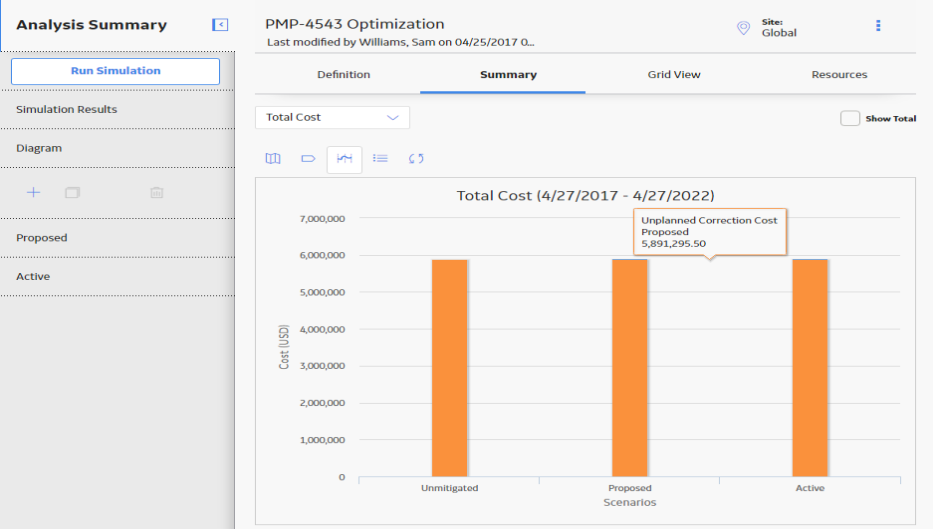
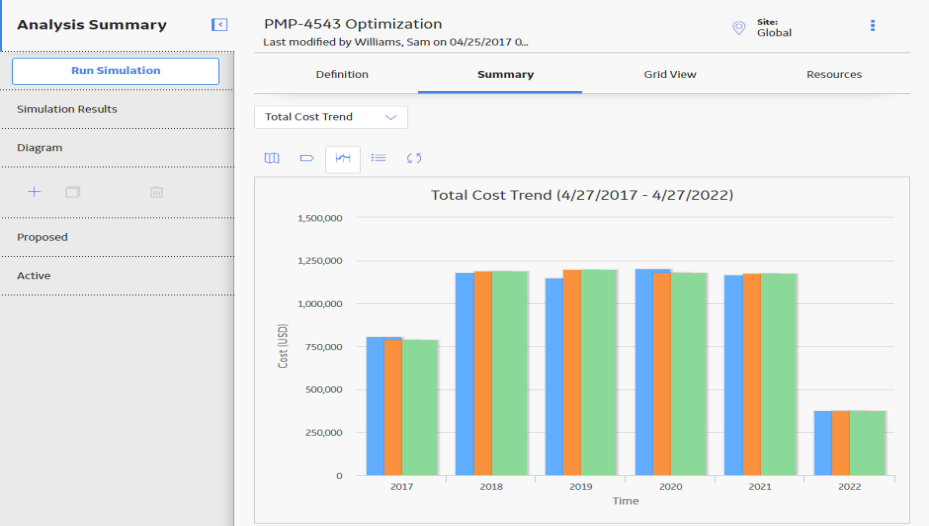
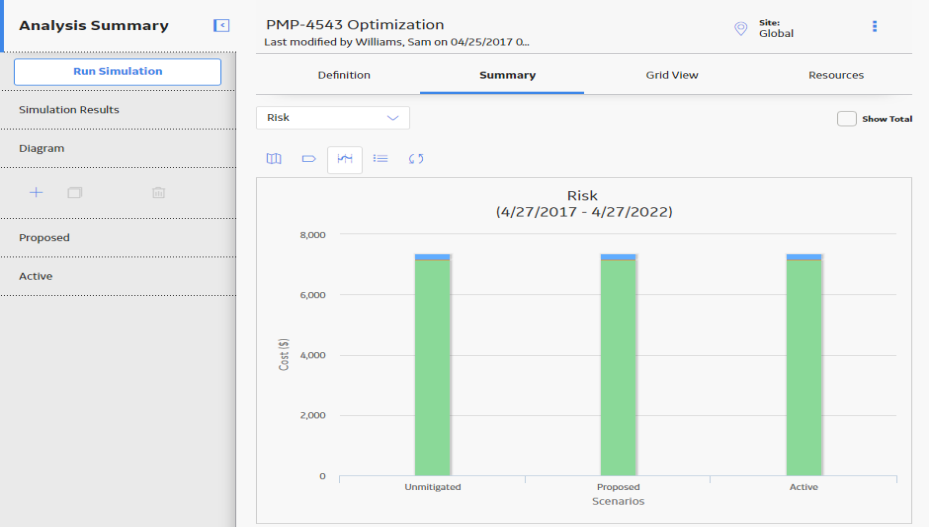
The ASO Analysis Summary workspace displays a summary of the simulation results that currently exist for an ASO Analysis.
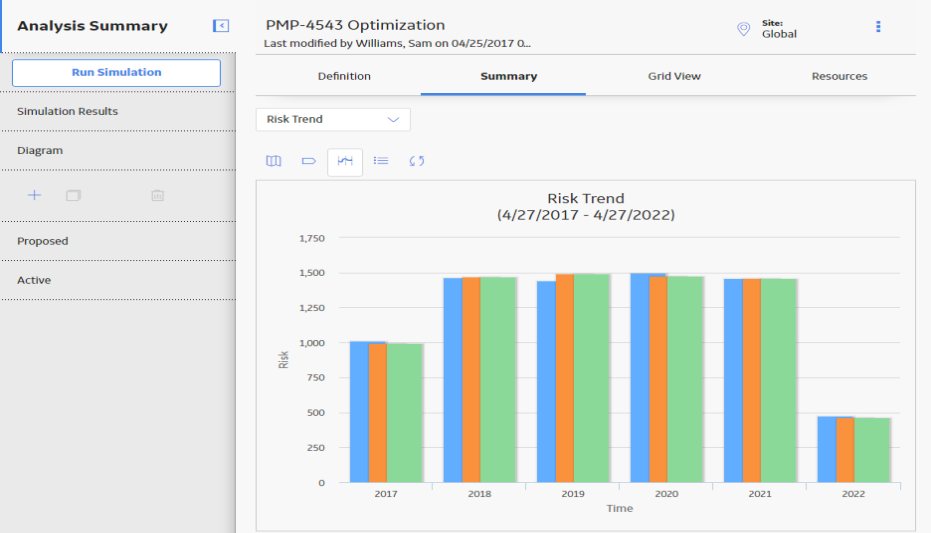
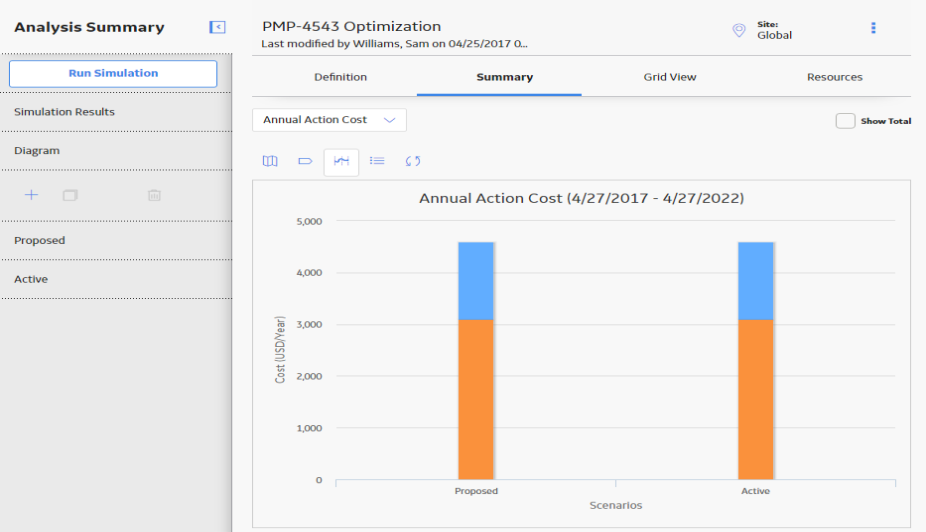
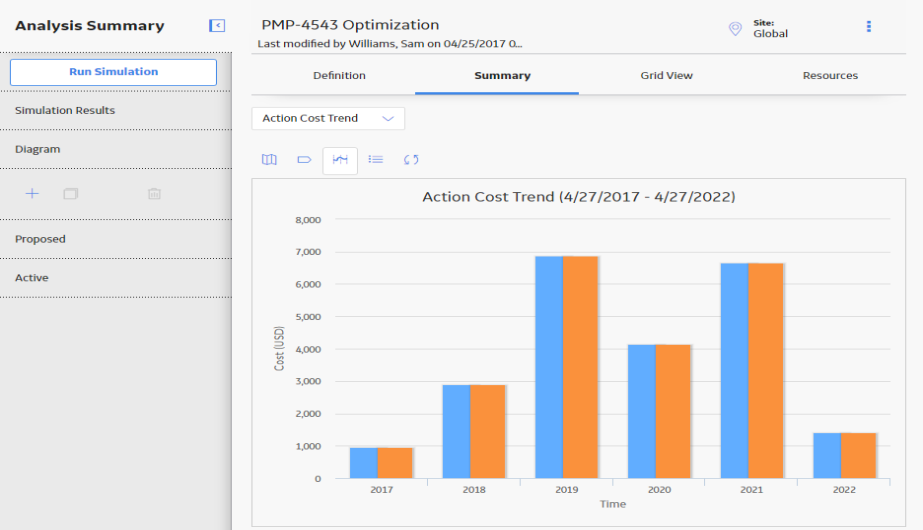
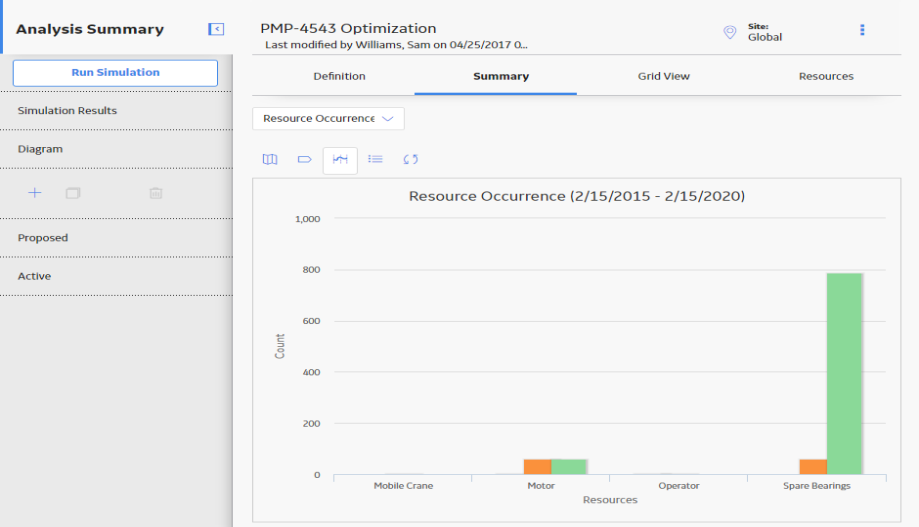
ASO Analysis Summary Workspace: Displays the simulation results for the following in a chart. At the top of the Summary section, in the drop-down list box, select any of the options below to see each result set.
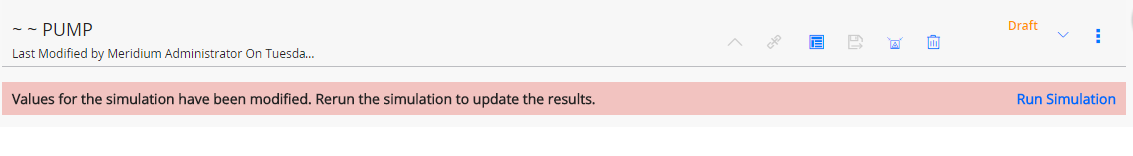
Note: If values that will affect the simulation results have been modified since the simulation was last run, a message will be displayed at the top of the page indicating that the simulation must be rerun. Whenever this message appears, we recommend that you rerun the simulation to ensure that valid results are displayed, as shown below.