 Historian
Maintain, Operate, and Monitor Historian
Plan For Data Recovery
Planning for data recovery means always having up-to-date backup files for important information to call up and restore quickly when the need arises.
- The .IHC file contains all configuration information.
- The *.IHA file is the current online archive files.
The .IHC file is automatically backed up when, and only when, you back up the current archive .IHA file. The .IHC uses the following naming convention: ComputerName_Config-Backup.ihc
By default, the .IHC backup path is the same as the archives path. If the default backup path is different than the archives path, the .IHC file is copied to the backup folder with the standard .IHC naming convention ComputerName_Config.ihc
Restoring the IHC file restores the system configuration (tag, archive, and collector configuration) to the state it was in before the event occurred. If you restore the archive file (IHA) along with the configuration file (IHC), you can quickly pick up where you left off when the event occurred with minimum loss of data.
Develop a Maintenance Plan
Daily Maintenance
On a daily schedule, perform the following backup operations unless you use ihArchiveBackup.exe to back up archives automatically.- Use the Historian Web Admin console to back up the current archive and most recent .IHA archived data file. This preserves data collected up to this moment in time. You do not need to back up any read-only archive files after they have been backed up once.
- Use Windows Explorer to back up the .IHC file if it has been modified by anyone (unless it is backed up automatically). This file contains all current configuration information (tag configuration, archive configuration, and collector configuration). Using this file, you can restore the system configuration after an unplanned shutdown.
Monitor Historian Performance
Historian provides a variety of performance counters and performance tags that can be used to monitor how well the Historian components are performing. These performance tags or counters can also be used to determine the resource usage on the computer that runs the Historian application.
Use performance tags to view information in an Excel report or SDK program, possibly along with other Historian tags. Use performance counters to view information in Windows Performance monitor, possibly along with non-Historian counter information.
Performance counters are useful when the Historian Web Admin console is not installed or cannot connect. Like any Windows performance counter, you must add the counters for collection to view history. Performance tags are always being collected and you can view past data any time.
Performance counters are updated in real time. Performance tags are updated once per minute with the activity over the last minute.
Performance counters contain more information than tags. Any counter can be collected to a tag using the Historian Windows Performance Collector. Those tags will count against your licensed tag count.
Historian Performance Tags
The following table provides information about the various Historian Server Performance tags.
| Tag Name | Description |
|---|---|
| PerfTag_CompressionRatio | Specifies the current effect of archive data compression. |
| PerfTag_MinimumCompressionRatio | Specifies the minimum compression ratio. |
| PerfTag_MaximumCompressionRatio | Specifies the maximum compression ratio. |
| PerfTag_TotalEvents | Specifies the total number of data samples reported to the Historian archive from all sources. . |
| PerfTag_TotalOutOfOrder | Specifies the total out of order data samples. |
| PerfTag_AverageEventRate | Specifies the average number of data samples per minute sent to archiver from all sources |
| PerfTag_MinimumEventRate | Specifies the minimum number of data samples per minute sent to archiver from all sources. |
| PerfTag_MaximumEventRate | Specifies the maximum number of data samples per minute sent to archiver from all sources. |
| PerfTag_WriteCacheHitRatio | Specifies the hit ratio of the write cache in percent of the total writes. |
| PerfTag_TotalFailedWrites | Specifies the total number of samples since startup that failed to be written. |
| PerfTag_TotalMessages | Specifies the total messages (for example, connection or audit messages) received by the archiver since startup |
| PerfTag_TotalAlerts | Specifies the total number of alerts received by the data archiver since startup. |
| PerfTag_FreeSpace | Indicates the free disk space left in the current archive. |
| PerfTag_SpaceConsumptionRate | Specifies an archive disk space consumption rate in megabytes per day. |
| PerfTag_PredictedDaysToFull | Indicates the approximate number of days required for an archive to fill. |
| PerfTag_MemoryUsage | Specifies the amount of RAM used by the Data Archiver. |
| PerfTag_MemoryVMSize | Specifies the amount of virtual memory used by the Data Archiver. |
| PerfTag_TotalAlarms | Specifies the total number of alarms received by the Data Archiver since starting up. |
| PerfTag_AverageAlarmRate | Specifies the average alarm rate in alarms per minute received by Data Archiver. |
| PerfTag_TotalFailedAlarms | Specifies the total number of alarms since startup that failed to be written. |
| Perftag_ReadQueueSize | Specifies the total number of messages present in the Read queue. |
| Perftag_AverageReadRate | Specifies the total number of data samples per minute returned from the Data Archiver for all read requests. |
| Perftag_ ReadQueuePushRate | Specifies the number of read requests per minute that came into the archiver from all clients. A read request can return multiple data samples. |
| Perftag_ WriteQueuePushRate | Specifies the number of write requests per minute that came into the archiver from all clients. A write request can contain multiple data samples. |
%CollectorName% with the name of a Collector.| Tag Name | Description |
|---|---|
PerfTag_%CollectorName%_InterfaceStatus | Specifies the status of an interface. |
PerfTag_%CollectorName%_InterfaceTotalEventsCollected | Specifies the total number of events collected by an interface. |
PerfTag_%CollectorName%_InterfaceTotalEventsReported | Specifies the total number of events reported by an interface. |
PerfTag_%CollectorName%_InterfaceOutOfOrderEvents | Specifies the total out of order events. |
PerfTag_%CollectorName%_InterfaceAverageEventRate | Specifies the average event rate of an interface. |
PerfTag_%CollectorName%_InterfaceMinimumEventRate | Specifies the minimum event rate of an interface. |
PerfTag_%CollectorName%_InterfaceMaximumEventRate | Specifies the maximum event rate of an interface. |
PerfTag_%CollectorName%_InterfaceOverruns | Specifies the interface overruns. |
PerfTag_%CollectorName%_InterfaceCompression | Specifies the compression of an interface. |
PerfTag_%CollectorName%_InterfaceOverrunsPercent | Specifies the number of overruns in relation to the total events collected since startup. |
Historian Server Performance Counters
The Windows performance counters are exposed as objects with counters. In the table below, you can see each counter and the object to which it belongs. Each object has one or more instances as shown in the Windows Performance Monitor.
| Archive Counter | Description |
|---|---|
| Cache Priority | Relative priority of items from the archive stored to the Windows Cache. A higher priority means the item is more likely to stay in cache. |
| Disk Read Time (usec) | Duration of last disk read in microseconds. |
| Disk Read Time Max (usec) | Maximum duration across all disk reads from the archive in microseconds. |
| Disk Reads | Number of disk reads from archive. |
| Disk Write Time (usec) | Time of last disk write in microseconds. |
| Disk Write Time Max (usec) | Maximum duration of all disk writes to the archive in microseconds. |
| Disk Writes | Number of disk writes to archive. |
| File Size (MB) | Size of the archive file in MB. |
| Read Calls | Number of read calls to the archive since startup. |
| Read Rate (Calls/min) | Number of read calls to the archive per minute. |
| Write Count | Number of data samples written to archive since startup. |
| Write Count Rate | Number of data samples written to archive per minute. |
| Writes Compressed | Number of data samples since startup that were compressed writes to the archive. |
| Writes Expensive | Number of data samples since startup that were expensive or slow. |
| Writes Failed | Number of data samples that were failed writes to the archive. |
| Writes OutofOrder | Number of data samples that were out of time order writes to the archive. |
| Cache Counter | Description |
|---|---|
| Hit Percentage | Hit rate percentage (0-100) for successful data retrieval calls to the cache. Higher numbers represent more efficiency. |
| Hits | Number of hits in the cache since startup. To reset the count, restart the Archiver. |
| Misses | Number of misses in the cache. |
| Num Adds | Total number objects added to cache. |
| Num Deletes | Total number of objects deleted from cache. |
| Num High Prio Objs | Number of high priority objects available for deletion. |
| Num Low Prio Objs | Number of low priority objects available for deletion. |
| Num Med Prio Objs | Number of medium priority objects available for deletion. |
| Obj Count | Number of objects in the cache. |
| Size (KB) | Size of cache in KB. |
| DataStores Counter | Description |
|---|---|
| Compression Ratio (Average) | Archive compression ratio for this data store. |
| Compression Ratio (Max) | Maximum archive compression ratio for the data store. |
| Compression Ratio (Min) | Minimum archive compression ratio for the data store. |
| Messages (Total Alerts) | Total alerts since startup |
| Messages (Total) | Total messages since startup. |
| Read Calls | Number of read calls to the data store. |
| Read Rate (Calls/min) | Average read rate across all archives in the data store. (Read Calls/Minute) |
| Read Samp Rate (Samp/min) | Average read rate across all archives in the data store. (Samples/Minute) |
| Space (Consumption MB/day) | Disk space consumption rate. (MB/day) |
| Space (Days To Full) | Number of days until current archive is full. |
| Space (Free in MB) | Free disk space in the current archive. |
| Write Rate (Average) | Average event rate across all archives. (Samples/Minute) |
| Write Rate (Max) | Minimum event rate across all archives. (Samples/Minute) |
| Write Rate (Min) | Minimum event rate across all archives. (Samples/Minute) |
| Writes (Cache Hit Ratio) | Write Cache hit ratio. |
| Writes (Compressed) | Total number of compressed data samples since startup. |
| Writes (Total Failed) | Total failed data sample writes since startup. |
| Writes (Total OutOfOrder) | Total out of order data samples since startup. |
| Writes (Total) | Total data samples across all archives since startup. |
| Overview Counter | Description |
|---|---|
| Compression Ratio (Average) | Average archive compression ratio of all data stores. |
| Compression Ratio (Max) | Average maximum compression ratio of all data stores. |
| Compression Ratio (Min) | Average minimum compression ratio of all data stores. |
| Memory Usage (KB) | Private bytes memory usage for Data Archiver. |
| Memory VM Size (KB) | Virtual Bytes memory usage for Data Archiver. |
| Messages (Total Alerts) | Sum of total alerts of all data stores since startup. |
| Messages (Total) | Sum of total messages of all data stores since startup. |
| Read Rate (Calls/min) | Sum of all average read rates of all data stores. (Samples/Minute) |
| Read Samp Rate (Samp/min) | Average read rate across all archives. (Samples/Minute) |
| Space (Consumption MB/day) | Sum of space consumption rate (MB/day) of all data stores. |
| Space (Days To Full) | Minimum number of days until current archive is full for all data stores. |
| Space (Free in MB) | Sum of all free space in the current archive of all data stores. |
| Write Rate (Average) | Sum of all average event rates of all data stores. (Samples/Minute) |
| Write Rate (Max) | Sum of all maximum event rates of all data stores. |
| Write Rate (Min) | Sum of all minimum event rates of all data stores. |
| Writes (Cache Hit Ratio) | Average write Cache hit ratio of all data stores. |
| Writes (Compressed) | Sum of total number of compressed data samples of all data stores. |
| Writes (Expensive) | Sum of total number of expensive writes data samples of all data stores. One of the reasons for expensive writes is out-of-order data. |
| Writes (Total Failed) | Sum of total failed data sample writes of all data stores. |
| Writes (Total OutOfOrder) | Sum of total out of order data samples of all data stores. |
| Writes (Total) | Sum of total data samples across all archives of all data stores. |
| Queue Counters | Description |
|---|---|
| ClientQueues with Msgs | The number of client queues with messages current on them. A lower number means all clients are up to date. A higher number means that the archiver is not up to date with incoming network traffic |
| Count (Max) | Maximum number of messages on the queue. (memory and disk) |
| Count (Total) | Number of messages on the queue. (memory and disk) |
| Disk Buf Msg Reads | Number of messages read from the disk buffer file. |
| Disk Buf Msg Writes | Number of messages written to the disk buffer file. |
| Processed Count | Number of messages processed from the queue since startup. |
| Processed Rate (msg/min) | Recent rate at which messages have been processed for the queue. |
| Processing Time (Ave) | Average time in milliseconds to process a message. |
| Processing Time (Last) | Time in milliseconds to process the last message. |
| Processing Time (Max) | Maximum time in milliseconds to process a message. |
| Recv Count (msgs) | Number of messages received into the queue. |
| Recv Rate (msgs/min) | Recent rate at which messages have been received for the queue. |
| Size Kb (Mem&Disk Max) | Max size of messages in Kb on the queue. (memory and disk). |
| Size Kb (Mem&Disk) | Size of messages in Kb on the queue. (memory and disk) |
| Size Kb (Mem) | Size of messages in Kb on the queue. (memory only) |
| Threads | Number of worker threads allocated to process this queue. This is the number of created threads but they may be idle. |
| Threads Working | Number of queue processing worker threads currently processing messages. |
| Time in Queue (Ave) | Average time in milliseconds that a message was in the queue, waiting to be processed. |
| Time in Queue (Last) | Time in milliseconds that the last message was in the queue, waiting to be processed. |
| Time in Queue (Max) | Maximum time in milliseconds that a message was in the queue, waiting to be processed. |
| Config Counters | Description |
|---|---|
| File Size | The size of the Configuration File in MB |
| Hist Tags(Actual) | Number of the Historical tags in the system |
| Hist Tags (Licensed) | Total licensed Historian tags. |
| Hist Tags(Used) | Effective number of Historical Licensed Tags in the system. Can be greater than the number of tags because some tags count as more than one Licensed Tag. |
| Hist Tags (UsedByArrays) | Effective number of Historical Licensed Array Tags in the system (Not the raw tag count, the effective licensed count). |
| Hist Tags (UsedByUserDef) | Effective number of Historical Licensed User Defined Tags in the system (Not the raw tag count, the effective licensed count). |
| Number of Collectors | Number of collectors defined on the system. |
| Number of EnumSets | Number of enumerated sets defined on the system. |
| Number of UserDefTypes | Number of user defined types defined on the system. |
| SCADA Tags (Actual) | Number of SCADA Tags in the system. |
| SCADA Tags (Licensed) | Total Licensed SCADA tags. |
| SCADA Tags (Used) | Effective number of SCADA Licensed Tags in the system. Can be greater than the number of tags because some tags count as more than one Licensed Tag. |
| SCADA Tags (UsedByArrays) | Effective number of SCADA Licensed Array Tags in the system (Not the raw tag count, the effective licensed count). |
| SCADA Tags (UsedByUserDef) | Effective number of SCADA Licensed User Defined Tags in the system (Not the raw tag count, the effective licensed count). |
Adding a Performance Tag
Procedure
Viewing Tag or Counter Trend Data
About this task
Procedure
- On the Tag Maintenance page, select a tag.
- Right-select the tag and select Trend. The trend for the selected tag displays.
Evaluate Data Compression Performance
You can determine how effectively data compression is functioning at any given time by examining the Collector Detail Diagnostics on the Collectors section of the Dashboard, as shown in the Understanding the Interface topic.
The compression field at the top of the page shows the current effect of archive compression. If the value is zero, it indicates that compression is either ineffective or turned off. If it shows a value other than zero, it indicates that archive compression is operating and effective. The value itself indicates how well it is functioning. To increase the effect of data compression, increase the value of the archive compression deadband so that compression becomes more active. Values for this parameter should typically range from 0 to 9%.
Handling Value Step Changes with Collector Data Compression
BigDiff=abs(HI_EGU-LO_EGU)*(CompressionDeadbandPercent/(100.0*2.0))*4.0
If ( Collector Compression is Enabled )
If ( Elapsed time since LastReportedValue>=( SampleInterval * 5 ) )
If ( abs(CurrentValue-LastReportedValue) > BigDiff )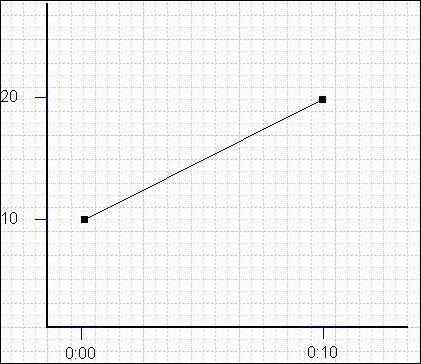
Write LastReportedValue,Timestamp=(CurrentTime-SampleInterval) Example: Value Spike with Collector Compression
| Time | X |
|---|---|
| 0:00:00 | 10.0 (steady state value) |
| 0:00:10 | 20.0 (new value after step change) |
| Time | X |
|---|---|
| 0:00:00 | 10.0 (steady state value) |
| 0:00:09 | 10.0 (inserted Marker value) |
| 0:00:10 | 20.0 (new value after step change) |

Historian Data Types
| Data Type | Size | Description |
|---|---|---|
| Single Float | 4 bytes | The single float data type stores decimal values up to 6 places. Valid ranges for the single float data type are 1.175494351e-38F to 3.402823466e+38F |
| Double Float | 8 bytes | The double float data type stores decimal values up to 15 places. Valid values for the double float data type are 2.2250738585072014e-308 to 1.7976931348623158e+308 |
| Single Integer | 2 bytes | The single integer data type stores whole numbers, without decimal places. Valid values for the single integer data type are -32767 to +32767. |
| Double Integer | 4 bytes | The double integer data type stores whole numbers, without decimal places. Valid values for the double integer data type are - 2147483648 to +2147483648. |
| Quad Integer | 8 bytes | The quad integer data type stores whole numbers without decimal places. Valid values for the quad integer data type are -9,223,372,036,854,775,808 (negative 9 quintillion) to +9,223,372,036,854,775,807 (positive 9 quintillion). |
| Unsigned Single Integer | 2 bytes | The unsigned single integer data type stores whole numbers without decimal places. Valid values for the unsigned single integer data type are 0 to 65535. |
| Unsigned Double Integer | 4 bytes | The unsigned double integer data type stores whole numbers without decimal places. Valid values for the unsigned double integer data type are 0 to 4,294,967, 295 (4.2 billion). |
| Unsigned Quad Integer | 8 bytes | The unsigned quad integer data type stores whole numbers without decimal places. Valid values for the unsigned quad integer data type are 0 to 18,446,744,073,709,551,615 (19 quintillion). |
| Byte | 1 byte | The Byte data type stores integer values. Valid values for the byte data type are -128 to +127. |
| Boolean | 1 byte | The Boolean data type stores boolean values. Valid values for the boolean data type are 0=FALSE and 1=TRUE. If the user sends zero, the value is taken as zero. Anything other than zero is treated as one. |
| Fixed String | Configured by user | The fixed string data type stores string data of a fixed size. Valid values are between 0 and 255 bytes. |
| Variable String | No fixed size | The variable string data type stores string values of undetermined size. This data type is useful if you cannot rely on a constant string length from your data source. |
| Binary Object | No fixed size | The binary object data type stores binary data. This is useful for capturing data that can not be classified by any other data type. |
| Scaled | 2 bytes | The scaled data type lets you store a 4-byte float as a 2-byte integer in the Historian archive. The scaled data type saves disk space but sacrifices data precision as a result. |
Additional Notes on Data Types
Quad Integer
If a tag is associated with Quad Integer, Unsigned Double Integer, or Unsigned Quad Integer data types and if you are retrieving data using Non-Web Admin, Excel Add-in, Calculation, ihSQL, and ihSDK, then there may be a loss of precision value due to a Visual Basic limitation.
Calculation collector supports only the calculations performed using the current value calculation. It does not support other calculations due to a Visual Basic script limitation.
The high and low EGU limits for Quad Integer, Unsigned Single Integer, Unsigned Double Integer, and Unsigned Quad Integer are between 2.2250738585072014e-308 to 1.7976931348623158e+308.
Fixed String Data Types
The fixed string data type lets you store string data of a fixed size. This is useful when you know exactly what data will be received by Historian. If a value is larger than the size specified in the Data Length field, it will be truncated.
Scaled Data Types
Historian uses the high and low EGU values to both store and retrieve archived values for the scaled data type. This allows you to store 4 byte floats as 2 byte integers in the Historian archive. Though this saves disk space, it also sacrifices data precision as a result. The smaller the span is between the high and low EGU limits, the more precise the retrieved value will be.
ArchivedValue = (((RealWorldValue - EngUnits->Low) / (EngUnits->High - EngUnits->Low) * (float) HR_SCALED_MAX_VALUE) + .5);Setting a Value For the Fixed String Data Type
Procedure
- In the Admin App, select Tags.
- Select the tag you want to configure.
- Select Collection.
- In the Data Type drop-down list, select Fixed String.
- Enter a value in bytes in the adjacent field. This field is enabled only when the data type selected is Fixed String.


