Manage Metric Views
Overview of Metric Views
Metric View is a visual representation of analytical data (cube), either in graph or tabular format. You can slice and dice the data using the dimension members. You can filter the data that is displayed in the Metric View by adding slices.
- All the bearing types that exist in the facility.
- How many of each bearing type exists in the facility.
- How many bearing failures occurred last year in the facility.
- Which type of bearing fails most often.
- How much it cost last year to fix the bearings that failed most often.
About Viewing a Metric View
When you create a new Metric View or open an existing Metric View, the Result section displays the result for the Metric View. This section offers two views of the Metric View: Graph view and Table view.
Graph View
By default, the result appears in Graph View format. The Graph View in the Result section provides a visual representation of the Metric View. You can modify the default graph settings by selecting the  button available on the Metric View design page. You can use a mouse pointer to zoom in by dragging out a rectangle shape in the data point of the chart. When you zoom in to the graph, the Reset Zoom button appears. You can select the Reset Zoom button to go back to the previous view of the graph.
For example, the following graph shows the Event Count and Average Corrective Work Cost based on the criticality of the equipment.
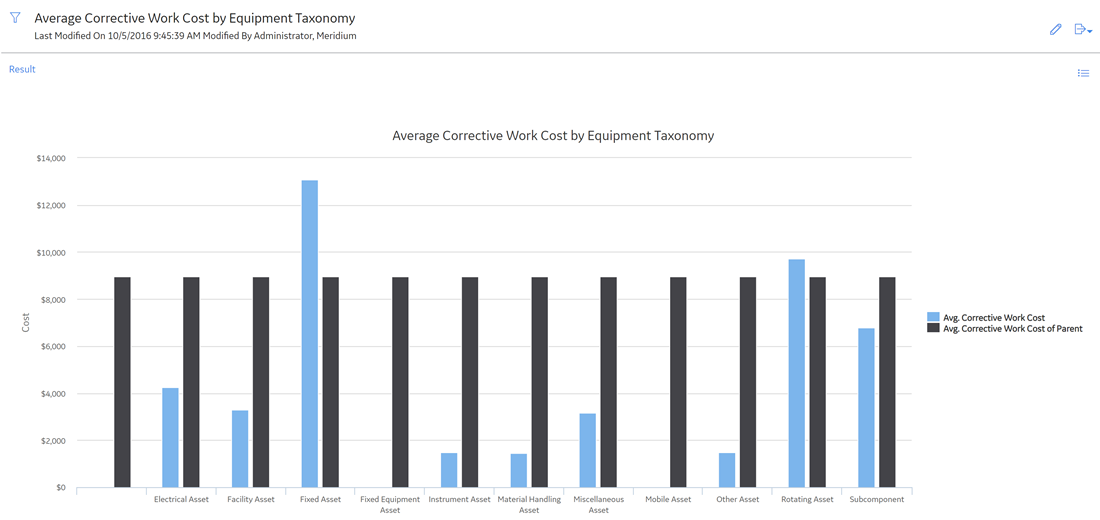
Table View
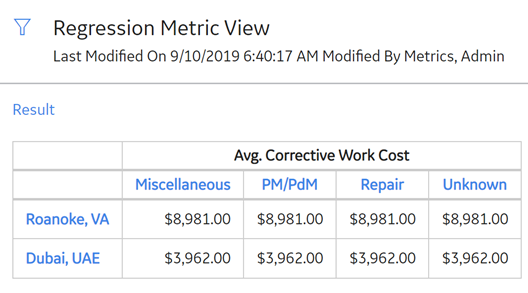
You can change the Graph View to Table View by selecting the  button in the Result section that is displayed in the Graph View. The Table View displays the same information that is displayed in the Graph View, but in a grid format.
Each row in the table corresponds to a value that appears along the x-axis of the graph. The columns in the table represent the values that are plotted on the y-axis of the graph. Using the Table View, you can easily view, the actual values that have been plotted on the graph.
For example, the following table shows the Event Count and Average Corrective Work Cost based on the criticality of the equipment. These same values are represented graphically in the preceding image.
About the MDX Queries
Multidimensional Expressions (MDX) allow you to query multidimensional objects such as cubes, and return the result set that contains the data from the cube.
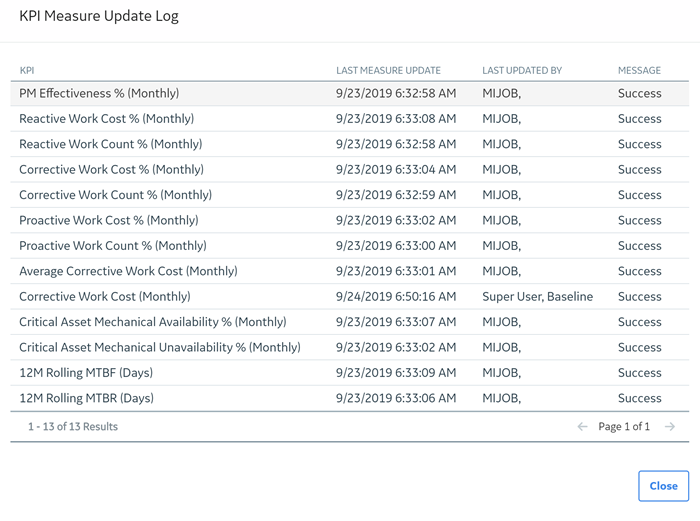
In the Metrics and Scorecards module, you can examine the corresponding MDX query for a Metric View. The MDX Query button displays the MDX Query window that allows you to manipulate the MDX on which the data is generated. It is recommended that you do not use the MDX Query window without prior knowledge of how to manipulate MDX. Note that if you open the MDX Query window, it will contain an underlying expression for the currently selected Metric View.
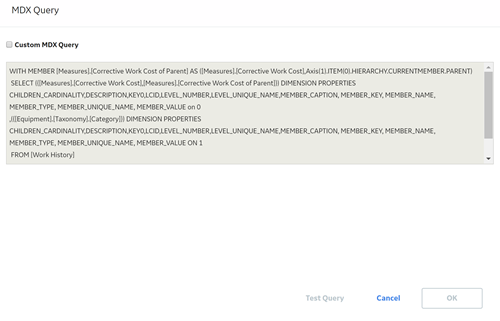
To specify a dataset, an MDX query must contain the following information:
- The number of axes.
- The members from each dimension to include on each axis of the MDX query.
- The name of the Cube that sets the context of the MDX query.
-
The members from a slicer dimension on which data is sliced for members from axis dimensions.
The general syntax of an MDX statement is:
            SELECT [<axis_specification>
            [, <axis_specification>…]]
            FROM [<Cube_specification>]
            WHERE [<slicer_specification>]]
In the MDX Query window, the SELECT statement is used to specify a dataset containing a subset of multidimensional data. The SELECT clause determines the axis dimensions of an MDX SELECT statement. The FROM clause determines which Cube is to be used when extracting data to populate the result set of the MDX SELECT statement. The optional WHERE clause determines which dimension or member to use as a slicer dimension; this restricts the results to a specific dimension or member.
About Including Actions in a Metric View
You can configure SQL Server Analysis Services cubes to contain Actions, which can provide users with access to extended data and information. Actions that are defined in Analysis Services Cubes will be available in the Metrics and Scorecards module within the Metrics View that are built upon those cubes. When you select the Action, the GE Digital APM system will launch the URL behind that Action.
- If the URL is a GE Digital APM URL, the target will open within the GE Digital APM application. For example, an Action can be configured to open a record in the Record manager. When you select the Action, the Record Manager page will appear, displaying the record specified in the URL. You can also configure a URL in SQL Server Analysis Services (SSAS) to open a report from reporting services.
- If the URL specifies a target that is external to GE Digital APM, the external URL will appear in another tab of the same browser. For example, Actions can be configured to display your customer's website on each customer level member.
When a user selects the Target in the Metric View that is built on a cube containing Actions, those Actions appear as buttons in the Metric View's workspace. When a user selects an Action, the Action will be invoked, and the target data will appear. You can configure multiple Actions for a cube.
The available Actions and the information displayed is determined by how the cube is configured in Analysis Services.
- Actions are attached to Targets, which correspond to member levels in a Metric View.Note: Actions can be attached to a Target at all member levels, including the cube level. Additionally, if an Action is configured on a member level, you will be able to see the Action only after you have drilled down to the associated level. For example, if an Action is configured for a member of Taxonomy Category level and you select the graph on All Taxonomy level, the Action will not appear in the workspace. You will be able to see the Action in the workspace only after you drill down to the Taxonomy Category and select a particular category (e.g., Fixed Asset).
- GE Digital APM supports the use of any Action for which a URL has been defined.
This documentation does not include details on configuring Actions in SQL Server Analysis Services (SSAS). Rather, we limit our discussion of Actions to how they can be invoked after they have been properly configured. For more information on defining Actions within Analysis Services cubes, refer to the SSAS documentation.
About the Drillthrough Feature
In a Metric View, you can drill through certain values in a table or a graph to view the underlying intersection data or source data. The intersection data displayed on the drill through is composed of data that is associated with the end value.
For example, suppose you have a Metric View that measures the total number of work orders over time. In this case, you could drill through the total number of work orders value for 2005 and view the underlying data that is associated with the work order, such as the equipment to which the work order was assigned, the department in which the equipment was located, and the manufacturer of the equipment to which the work order was assigned. Drill through data provides you with a more complete understanding of the Metric View.
The availability of the Drillthrough feature and the data that is displayed is determined by how the associated cube has been configured in Analysis Services.
About Drilldown and Drillup
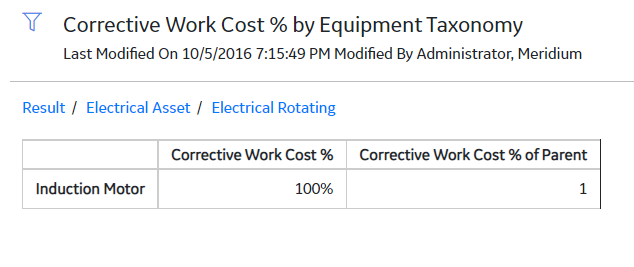
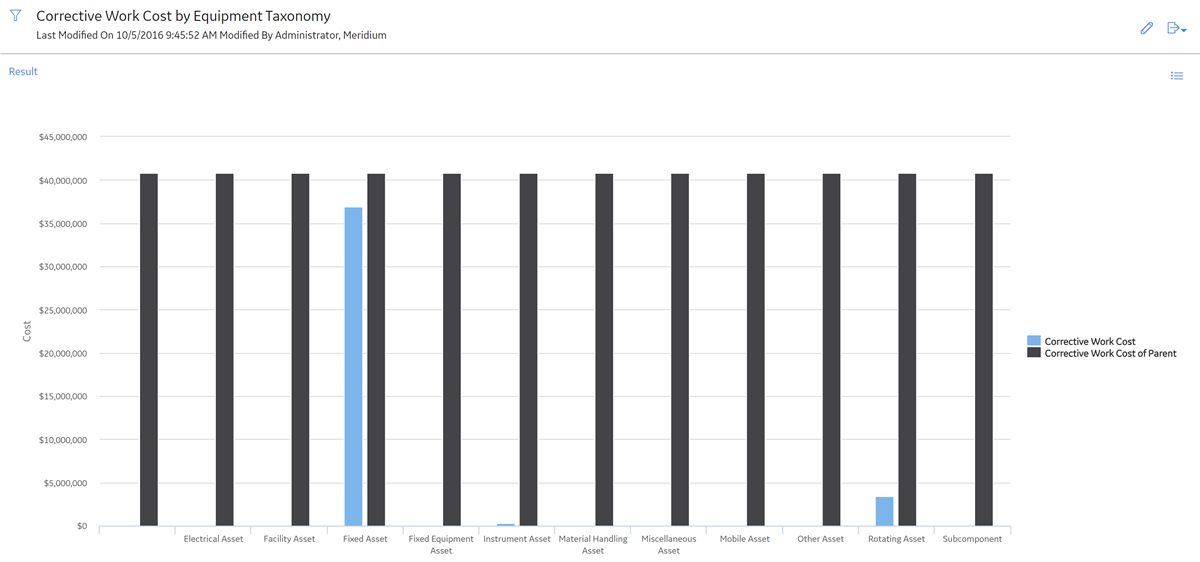
By drilling down into a graph or a table view, you can view the details of each item represented in the graph. The items contain different levels, each with a greater amount of detail about a given category. For example, consider the following table.
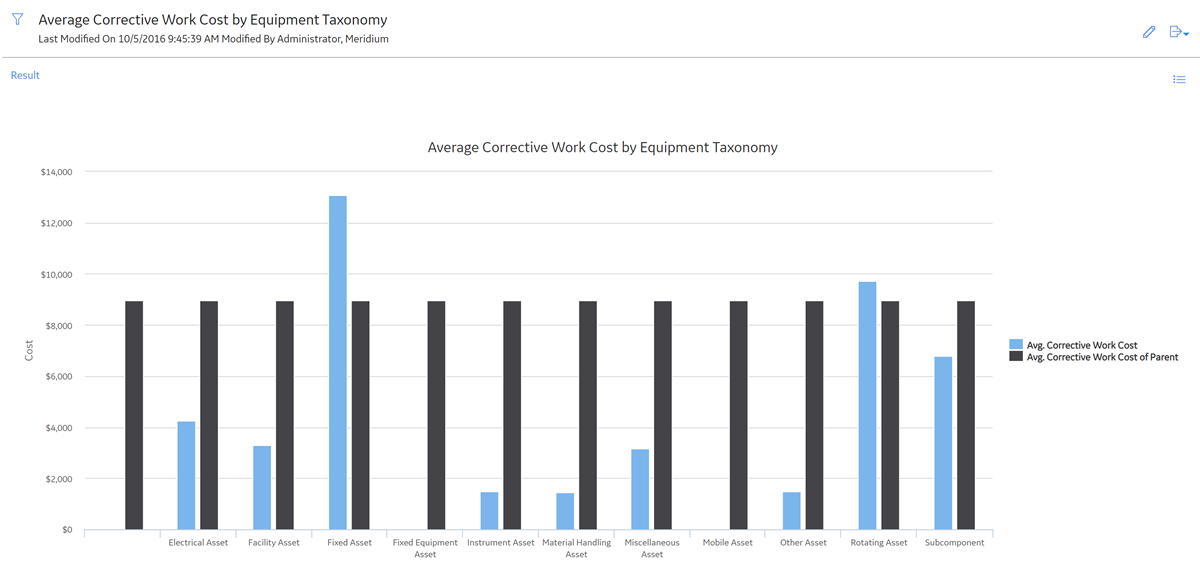
This following graph shows the Average Corrective Work Cost for all Equipment Taxonomy. You can see that across all Equipment Taxonomy, there are 12 Equipment Taxonomy. When you drill down into the All Equipment Taxonomy, you can see Average Corrective Work Cost per Equipment Taxonomy, as shown in the following image.
About Right and Left Y-Axis Scales in a Metric View
When you create a new Metric View, the y-axis label and scale appear by default on the left side of the graph. If the graph contains multiple measures for each x-axis category, all the measures initially use the same scale, which is determined automatically using the plotted minimum and maximum values. The default scale is not necessarily appropriate for all the plotted values.
When a single scale is not appropriate for plotting all the values on the y-axis, you can use two scales, one on the right and one on the left, and choose which values should use each scale.
Access the View Page of a Metric View
Before You Begin
- You must have View permission on the Catalog folder to view an existing Metric View.
- You must also have View permission on the cube to view the data of the Metric View.
Procedure
Access the Metric Views Design Page
Procedure
Access an MDX Query
About This Task
Procedure
Create a Metric View
When you create a Metric View, you select measures and dimensions associated with a cube. The corresponding graph appears in the Result workspace of the page.
Before You Begin
- To create a Metric view, a user must first have at least View permission on the Cube.
Procedure
Create a Copy of a Metric View
Procedure
Sort the Table
About This Task
Procedure
Create a Calculated Measure
About This Task
Procedure
Calculated Measures
You can create calculated measure in two places; in cube (SSAS) and in Metric View design page. The calculated measure appears in Metric View design page in Data/Measures section.
- Contribution
- Difference
- MDX Query
| Field | Data Type | Description | Behavior and Usage |
|---|---|---|---|
| Calculated measure type | N/A | Type of measure function that you want to perform. | You can either create the calculated measure by using the existing functions, such as, Difference or Contribution in the interface, or write custom MDX by selecting the Custom function.
|
| Dimension Hierarchy | N/A | The dimension member that you have added in Rows/X-Axis or Columns/Legend. | Select the dimension member from the Dimension Hierarchy box. |
| First measure | N/A | The first member for the calculation, Difference. | None |
| Measure | N/A | The measure for which you want to create the contribution. | Select the measure from the Measure drop-down list. |
| Name | Character | Name of the calculated measure | Appears in the Metrics View design page in the Data/Measures section and in the Result workspace as a new measure. |
| Second measure | N/A | The second member for the calculation, Difference. | None |
Examples of Calculations
The following are some of the examples of creating calculated measures in a Metric View.
Example 1:
In the following example, a particular piece of equipment, in addition to its family and subfamilies, is being evaluated on its financial opportunity in comparison to all pieces of equipment. The user has chosen to work with the dimension Measures, and the Financial Opportunity within the dimension. This number has been divided by a sum based on the current member's ancestor and children, and its Financial Opportunity.
[Measures].[Opportunity_$$]/Sum({Ancestor([Equipment].CurrentMember, 1).Children}, [Measures].[Opportunity_$$]))
Example 2:
You may choose to elaborate on a basic query to specify the results for null measurements. The following example builds on the previous example. This instance illustrates the opportunity cost divided by low-level children of a high-level parent. In the first line, the MDX query specifies that if the current member (the piece of equipment) does not have a parent family, the result for the calculation result will be 1. The bold section of the following code states that if the measure Opportunity Cost equals 0, then the results should return the calculation 0.
IIF(Ancestor([Equipment].CurrentMember, 1) IS NULL, 1, IIf([Measures].[Opportunity_$$]=0 ,0,[Measures].[Opportunity_$$]/Sum({Ancestor([Equipment].CurrentMember, 1).Children}, [Measures].[Opportunity_$$])))
Example 3:
A value expression can be used to evaluate overall repair cost, and the costs within a site. The difference in a repair cost can be compared between all repairs for a site, and then all repairs for a particular piece of equipment. For this type of calculation, you would type in the [Measures] dimension, and then the measure Cube, [Site Repair] (see example).
Difference in repair cost
[Measures].[Site_Repair_Cost] - [Measures].[Company_Wide_Repair_Cost]
Example 4:
An MTBF calculation can be created with a fixed analysis period. For example, the percentage of repairs within a given time period can be calculated. In this case, we will limit the length of the fixed analysis period to 1748 days. As stated in the highlighted area, if the number of repairs equals 0, then the result of the calculation will be 0.
IIf([Measures].[N of Repair]= 0, 0, 1748 x [Measures].[N of Equipment]/[Measures].[N of Repair])
Example 5:
The example shows an MTBF calculation with a 12-month Moving analysis period (length 12 month). The calculation results will change depending on the current member (the current month). Figures are calculated dynamically. If there's no monthly data, a 0 will be calculated.
12 x ([Measures].[Number of Equipment], [Failure Date].[All Failure Dates])/
IIf(isempty([Failure Date].currentmember.lag(11)), 0, Sum({[Failure Date].currentmember.lag(11): [Failure Date].currentmember},[Measures].[Total Number of Failures]))
Sum({set: date from last 11 month to current month}, measure)
To specify that the system should check to see if there are a total of 12 months (11 back from the current month), type in the following code. If 12 months do not exist, the value is calculated as 0. Otherwise, the MTBF is calculated in the Month unit.
IIf(isempty([Failure Date].currentmember.lag(11)), 0, otherwise)
Basic Definitions of Calculations in Work History Cube
The following table lists the basic calculations and the definitions of the measures provided in the Work History cube.
| Measure | Definition |
|---|---|
| Corrective Work |
Corrective Work Orders are repair work orders associated with restoring an asset after a breakdown or in response to performance degradation. It can also be the work to restore the asset to its prime condition as a result of a predictive maintenance (PdM) activity finding. Corrective Work = Breakdown Repairs + Degradation Repairs |
| Critical Assets | The assets with high criticality. |
| Failure Event | The repair events with breakdown. |
| Mechanical Downtime | The amount of time a piece of equipment is not operating due to a work event or failure. The calculation for this measure is: Maintenance Completion Date - Maintenance Start Date |
| Proactive Work | Proactive work is maintenance work that is completed to avoid failures or to identify defects that could lead to failures. It includes routine preventive and predictive maintenance activities and work tasks. |
| Reactive Work | Reactive work is maintenance work that breaks into the weekly schedule. Reactive work cost is calculated using the priority on the work order. Emergency Work Orders are considered to be breaking into the weekly schedule. Any order type except for miscellaneous can be included in this calculation. |
Work History Cube Calculations
The following table displays the calculations that are used in Work History cube in the Metrics and Scorecards module.
|
Metric | Definitions |
Metric Calculation |
Units |
|---|---|---|---|
| Asset Count | Asset Count is the count of equipment or functional locations | Count of Equipment or Count of Functional Locations | Number |
| Average Corrective Work Cost | Average Corrective Work Cost is a financial indicator of the effort required to repair failing or failed assets expressed in dollars. This metric is determined by dividing the total corrective work costs related to an asset (or category, class, type or model of assets) for a given period by the number of events in that period. | Corrective Work Cost / Corrective Work Count | U.S. Dollars |
| CAMA% (Critical Asset Mechanical Availability Percentage) | The Critical Asset Mechanical Availability is an indicator of the time that a critical asset is available for service or can perform its intended function. This metric is a measurement of the time that a critical asset is available to perform its intended function. The calculation is expressed as a percentage of the total time under review. | 1-CAMU% | Percentage |
| CAMD (Critical Asset Mechanical Downtime) | The Critical Asset Mechanical Downtime metric is an indicator of the days that a critical asset is unavailable for service; the time it is shutdown. This metric is expressed in total shutdown days. The calculation is expressed as the cumulative days of downtime under review. | Total Mechanical Downtime For Critical Assets / Critical Asset Count | Days |
| CAMU% (Critical Asset Mechanical Unavailability Percentage) | The Critical Asset Mechanical Unavailability metric is an indicator of the percentage of time that a critical asset is unavailable for service, or cannot perform its intended function. This metric is expressed in a percentage of the total time. The calculation is expressed as a percentage of the total time under review. | CAMD / Number of Days in Time Range | Percentage |
| Corrective Work Count | Count of events which can be classified as corrective work | Count of events which can be classified as corrective work | Number |
| Corrective Work Count % | The Corrective Work Count % is a numeric indicator of the number of corrective failure events as a percentage of the total work experienced by a maintenance group. | Corrective Work Count / Count of non-miscellaneous work | Percentage |
| Corrective Work Cost | The Corrective Work Costs are financial indicators of the effort required to repair failing or failed equipment. The calculation is expressed in dollars. | Total Maintenance Cost for All Corrective Work | U.S. Dollars |
| Corrective Work Cost % | Corrective Work Cost / Maintenance Cost for non-miscellaneous work | Corrective Work Cost / Maintenance Cost for non-miscellaneous work | Percentage |
| Critical Asset Count | Count of Assets with High Criticality | Count of Assets with High Criticality | Number |
| Event Count Non Misc | Count of non-miscellaneous events | Count of non-miscellaneous events | Days |
| Failure Event Count | Count of Event where Breakdown is equal to True | Count of Event where Breakdown is equal to True | Number |
| Failure Rate (FPMH) | Failure Rate is a numeric indicator of the frequency at which an asset fail for selected equipment types. This metric provides information on the expected failure per million hours of operational time. | 1000000 / (MTBF x 24) | Number of failures per million hours |
| Maintenance Cost Non Misc | Maintenance cost for all the non miscellaneous work | Maintenance cost for all the non miscellaneous work | U.S. Dollars |
| MTBF(Days) (Mean time between Failures) | The Mean time Between Failure (MTBF) is a numeric indicator of the average operating time between failures that are repaired for selected equipment types (assumes instant repairs). This metric is used to trend the time that assets are available for service. An increase in MTBF indicates improved asset reliability. SMRP Definition: Mean Time Between Failures is the average operating time between failures for an asset or component, where the failure means that an asset is unable to perform its required function. In GE Digital APM, a failure is indicated when the breakdown indicator is set to True. | (Asset Count x Total Calendar Time in Days) / (Failure Event Count) | Days |
| MTBR(Days) (Mean Time Between Repairs) | Mean Time Between Repairs (MTBR) is a numeric indicator of the average time between the completion of one repair to the beginning of the next. The MTBR addresses the time that an asset is not involved in a repair cycle. This metric is a numeric indicator of the average time between the completion of one repair to the beginning of the next. | (Asset Count x Total Calendar Time in Days) / (Corrective Work Count) | Days |
| Preventative Maintenance Effectiveness % | This metric indicates predictive maintenance effectiveness relating to the work generated by PdM programs. This metric is a useful measure of result generated from predictive activities, so the customers who include a Detection Method field in their data will be able to take advantage of it. In addition, if the work request references another work order of type PM or PdM, then we can calculate the PM effectiveness. The Preventative Maintenance Effectiveness metric is an indicator of the percentage of proactive work that is generated because of PM/PdM programs. Effective programs detect potential failures or degraded performance before plant operations are negatively affected. | Repair Count with PM or PdM detection / Corrective Work Count | Percentage |
| PM Effectiveness% | This metric indicates predictive maintenance effectiveness relating to the work generated by PdM programs. This metric is a very useful measure of results created from predictive activities, so those customers who include a Detection Method field in their data will be able to take advantage of it. In addition, if the work request references another work order of type PM or PdM then you can calculate the PM effectiveness. The Preventative Maintenance Effectiveness metric is an indicator of the percentage of proactive work that is generated because of PM/PdM programs. Effective programs detect potential failures or degraded performance before plant operations are negatively affected. | (Repair Count with PM/PdM Detection) / (Corrective Work Count) | |
| Proactive Work Cost | Total Maintenance Cost for All Proactive Work | Total Maintenance Cost for All Proactive Work | U.S. Dollars |
| Proactive Work Cost % | The Proactive Work Cost % is a numeric indicator of the cost associated with proactive work events as a percentage of the total. | Proactive Work Cost / Maintenance Cost for non-miscellaneous work | Percentage |
| Proactive Work Count | Proactive work is maintenance work that is completed to avoid failures or to identify defects that could lead to failures. It includes routine preventive and predictive maintenance activities and work tasks identified from them. As maintenance groups prefers reliability, this percentage should rise. In organizations, proactive work will include the majority of plant repairs. All the organizations might not have notifications for predictive for preventive work, but will create preventive work orders from the preventive maintenance plan. Therefore, you need to compare the cost on the work orders. | Count of events which can be classified as Proactive Work | Number |
| Proactive Work Count % | The Proactive Work Count % is a numeric indicator of the number of proactive work events as a percentage of the total. This metric calculates a percentage of the PdM and PM events as a percentage of the total work. | Proactive Work Count / Count of non-miscellaneous work | Percentage |
| Reactive Work Cost | Reactive work is maintenance work or emergency work orders that occurs in the weekly schedule. Reactive work cost is calculated using the priority on the work order. Any order type except for miscellaneous can be included in this calculation. | Total Maintenance Cost for all Reactive Work | U.S. Dollars |
| Reactive Work Cost % | The Reactive Work Cost% is a numeric indicator of the costs associated with the reactive work experienced by a maintenance group. This calculation is expressed as a percentage of the work. | Reactive Work Cost / Maintenance Cost for Non-Miscellaneous Work | Percentage |
| Reactive Work Count | Reactive work is maintenance work or emergency work orders that occurs in the weekly schedule. Reactive work cost is calculated using the priority on the work order. Any order type except for miscellaneous can be included in this calculation. | Count of events which can be classified as Reactive Work | Number |
| Reactive Work Count % | The Reactive Work Count % is a numeric indicator of the costs associated with the reactive work taken by a maintenance group. This calculation is expressed as a percentage of the total work. | Reactive Work Count / Count of Non-Miscellaneous Work | Percentage |
| Repair Cost with PM/PdM Detection | Total Maintenance Cost for Corrective Work with PM/PdM detection. | Total Maintenance Cost for Corrective Work with PM/PdM detection. | U.S. Dollars |
| Repair Count with PM/PdM Detection | Count of Repair Events with PM/PdM Detection | Count of Repair Events with PM/PdM Detection | Number |
| Total Mechanical Downtime for Critical Assets | Sum of Mechanical Downtime for Critical Assets | Sum of Mechanical Downtime for Critical Assets | Days |
Add Filters to a Metric View
By adding filters, you can view a subset of the results that are currently displayed in the Results workspace for a Metric View. By default, the top 20 count will be applied on the measure in the row and column. This is to avoid the browser to go into an unrecoverable state when the query result set is large. If you want to modify the filter, you need to manually edit the filter. In case of a drilldown too, the same top 20 count filter will be applied.
Before You Begin
- Create a Metric View and specify dimension members for the Rows/X-axis or Columns/Legends.
Procedure
Row and Column Filter Options
The filter options that you select on the Row Filters or Column Filters window function as a formulaic expression. This means that all of your selections work together to create a logical statement that tells the GE Digital APM system which columns or rows to exclude from the result displayed in the table and chart.
The following filter options are available on the Edit Filter window.
| Field | Data Type | Description | Behavior and Usage |
|---|---|---|---|
| Function | N/A | Lets you choose the various functions. | You can add multiple filters. When deleting the members from either Rows/X-axis or Column/Legend section, you must retain at least one member for the filter to appear correctly. Contains the following options:
|
| Measure | N/A | A list of available measures in the cube. | The filter will be applied on the measure selected from this list. |
| Value | Number | Lets you specify a numeric value. | The value specified in the Value box will be used as a filter criteria. |
Modify the Filters Applied to a Metric View
Before You Begin
About This Task
Procedure
Modify the Graph Settings
About This Task
Procedure
Edit Graph Settings
Graph
| Fields | Data Type | Description | Behavior and Usage |
|---|---|---|---|
| Graph Title | Character | A label that indicates the title of the graph displayed on the Results workspace. | Enter a title for the graph in the text box. |
| Graph Type | N/A |
A property that identifies the type of graph that you want to view. | Displays a drop-down list of graph types. Select the type of graph that you want to be displayed on the Results workspace. The following graph types are supported:
|
| Show Legend | N/A | The legends indicates the meaning of each color in the graph. | Select the check box to display the legends on the graph and from the corresponding drop-down list, select the area where you want to display the chart legends. |
| Show Scroll Bar | N/A | An option that lets you control the number of data series that appear on the graph's x-axis within a chart area by using a scroll bar. | Select the check box if you want to allow x-axis panning on the graph. On selecting the check box, the Maximum amount of points to show box appears. In this box, you can specify the number of data series to be displayed on the graph at a time. This is a required field. |
Series
| Fields | Data Type | Description | Behavior and Usage |
|---|---|---|---|
| Color Palette | N/A | A property that allows you to select colors for data series. | Displays a list of color. Each color displays a drop-down list of color schemes from which you can select a color for a data series. |
| Graph Type | N/A | A property that identifies the type of graph that you want to plot for a measure. | This field is populated with available chart types when you select the Graph Type as Combination in the Graph section. This is useful if you have more than one measure. |
| Measure | N/A | Displays the measure name that you have selected Data/Measures in the Metric View. | Populated automatically. The measures are used in plotting the graph based on the selected graph type. |
| Series settings | N/A | Allows you to configure a dual axis graph. For example, Y and Y1 axis. | Select the measure that should be plotted on the Y and Y1 axis for column chart and X and X1 for bar chart. This is recommended if you have two measures to be plotted. |
| Stacked | N/A | A property that allows you to present your data on the chart in stacked bar graph format. | Stacked chart compares data sets by placing one set of data on top of another. Each dataset is represented in a different color and each individual stacked column size represents the contribution proportionate to the total value. Select the check box, if you want the graph to appear stacked. |
| y Axis | N/A | A property that identifies the location for the measures to be plotted on the y Axis. | Select the y axis location from the drop-down list. This field allows you to configure measure in Y or Y1 axis using the values, Left or Right. |
Axes
| Fields | Data Type | Description | Behavior and Usage |
|---|---|---|---|
| Formatter | N/A | Lets you specify the type of numbers to appear on the axis and formats the scale accordingly. | You can select the format as Number, Currency (e.g., using dollar sign), Percentage and so on. You can also select the number of decimal places to which the values will be rounded when they are displayed on the axis by selecting Number with 0 precision, Number with 1 precision and so on. |
| Left | N/A | Lets you configure settings for a data set plotted on the of the y-axis. | You can configure the following settings, Format, Type,Title, Minimum, and Maximum for the Y-axis. |
| Minimum | Number | Lets you specify the minimum value that should be plotted on the y-axis of the graph. | This is an optional field. When you specify a minimum value, the graph is plotted from that value. |
| Maximum | Number | Lets you specify the maximum value points that should be plotted on the y-axis of the graph. | This is an optional field. When you specify a minimum value, the graph is plotted till that value. |
| Right | N/A | Lets you configure settings for a data set plotted on the of the y1-axis. | You can configure the following settings, Format, Type,Title, Minimum, and Maximum for the Y1-axis. |
| Title | Character | A label that will indicate the name for the values that are plotted on the y and y1 axis. | Enter the name in the Title box. The name provided for both Y and Y1 axis will overwrite the default label. |
| Type | N/A | An option that lets you specify the scaling type for y and y1 axis. |
Note: By default, the charts are displayed in Linear type.
|
| X Axis Title | N/A | A label that indicates the name for the x-axis. | Enter the name in the X Axis Title box. The name will appear on the x-axis of the graph. |
| y Axis | N/A | A property that identifies the location for the measures to be plotted on the y Axis. | Select the y axis location from the drop-down list. This field allows you to configure measure in Y or Y1 axis using the values, Left or Right. |
| Y Axis Formatting | N/A | List of options that lets you define the format for the values that are plotted on the left and right sides of y-axis. For example, y-axis title, setting minimum and maximum value. | In this section, you can change the y-axis settings, such as Number format, Title and so on. |
Zoom In and Out of the Graph in a Metric View
Procedure
Invoke Actions in a Graph for Metric Views
Before You Begin
- Create a Metric View using the cube on which the actions are defined.
About This Task
- You have used Calculated Measure in the Metric View.
- If the Analysis Server is being cached at that moment.
Procedure
Drill Down a Metric View
Procedure
Drill Down a Metric View in the Tabular View
Procedure
Drill Through a Metric View
Before You Begin
Procedure
Export a Metric View
You can export a Metric View (both graph view and tabular view) to a PDF.
Before You Begin
Procedure
Export a Drill Through Result
About This Task
By default, the Drillthrough Result window displays the first 100 records of the result. However, if you want to analyze the complete result set of the drill through action, you can export all the results to a .CSV file.
 to search for an existing Metric View.
 .
. .
. , and then select
  .
. .
. .
. to specify measures in which you want to add filters.
 .
. that appears next to the name of the filter.
 .
.
 to export the Metric View in PDF format.
 .
.