General Reference
About Site Filtering in AHM
In Asset Health Manager, users will see only the health information related to assets assigned to their site(s) or that are global records.
In most cases, the asset, health indicator source, and health indicator will all be associated with the same site, though it is possible for a health indicator source record to contain global data. For information on configuring this scenario, refer to the AHM Administration section of the help.
Consider an organization that has three sites, Site X, Site Y, and Site Z. Measurement Location A is a global record and is linked to the following two equipment records:
- Equipment 1: Assigned to Site X
- Equipment 2: Assigned to Site Y
Two Health Indicator records exist for the Measurement Location, one for each piece of equipment.
Scenario 1: User assigned to only Site X
When this user views the Health Summary page, he or she can view Equipment 1, Measurement Location A, and the health indicator associated with Equipment 1. Equipment 2 and the associated health indicator are not visible.
Scenario 2: User assigned to both Site X and Site Y
When this user views the Health Summary page, he or she can view Equipment 1 and 2, Measurement Location A, and the health indicators associated with both Equipment 1 and 2.
Scenario 3: Super User
When this user views the Health Summary page, he or she can view Equipment 1 and 2, Measurement Location A, and the health indicators associated with both Equipment 1 and 2. If any records are assigned to Site Z, he or she would be able to see the related data for those records as well.
About Health Indicator Sources
Health Indicator records are associated with health indicator source and reading source records that contain the limit values and reading values, respectively, that are compared to determine the status of the health indicator. One health indicator may exist for each health indicator source record associated with a piece of equipment. Reading source records are then used to provide the most recent reading value to the health indicator.
The following table summarizes the records that are configured as sources in the baseline GE Digital APM database.
| Health indicator source record | Corresponding reading source |
|---|---|
| GE Tag | GE Tag Event records |
| Measurement Location | Reading records |
| Content Map | The most recent reading available from the OT Source. |
| KPI | KPI Measurement records |
| None (e.g., health indicators created via Policy Designer) | Health Indicator Value records |
The following table summarizes the fields that define health indicator limit values for each of the baseline health indicator source records.
| Health indicator source record | Fields Containing Limit Values |
|---|---|
| GE Tag | Upper and lower level limit fields in the GE Tag record. |
| Measurement Location | Upper and lower level limit fields in the Measurement Location record. |
| Content Map | Upper and lower level limit fields in the Content Map record. |
| KPI | Target and Critical fields in the KPI Measurement record associated with the KPI record.
|
| None | Upper and lower level limit fields in the Health Indicator record. |
The following table summarizes the fields in each reading source record that contain the latest reading value, which the Asset Health Indicator service copies into either the Last Numeric Reading Value or Last Char Reading Value field in corresponding Health Indicator records.
| Reading source | Field Containing Reading Value |
|---|---|
| GE Tag Event record | Type |
| Reading record | Reading Value Character Reading Value Numeric |
| Reading from the OT Source | N/A |
| KPI Measurement record | Actual |
| Health Indicator Value record | Value (Numeric) |
AHM Data Model
The following diagram shows how the families used in Asset Health Manager are related to one another.
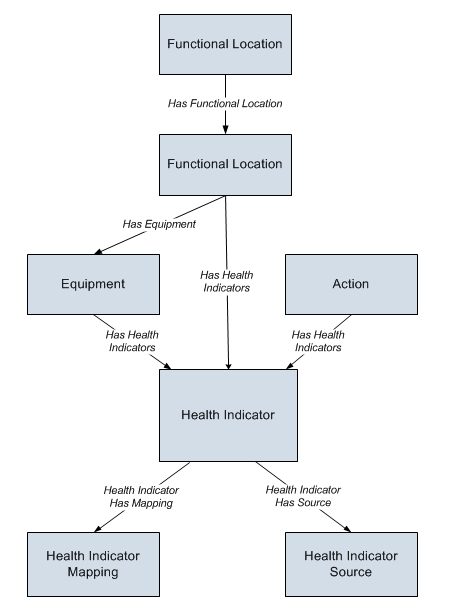
Note that the Health Indicator Source box in this image does not represent a family with the caption Health Indicator Source. Instead, it represents a family containing a record that will be linked to a Health Indicator record. In the GE Digital APM baseline database, Health Indicator records can be linked to the following types of records through the Health Indicator Has Source relationship:
- Measurement Location
- Content Map
- KPI
- Health Indicator
If desired, you can configure this relationship definition to include other families as successors to the Health Indicator family.
Each Health Indicator record is also associated with readings linked to these health indicator source records. Refer to the topic About Health Indicator Sources for details.
AHM URLs
There is one URL route associated with Asset Health Manager: health. The following table describes the various paths that build on the route, and the elements that you can specify for each.
| Element | Description | Accepted Value(s) | Notes |
|---|---|---|---|
| health: Opens the Health Summary page displaying health indicators at the Home level of the hierarchy. | |||
| health/overview: Opens the Asset Health Manager Overview page. | |||
| health/asset/<EntityKey>/<SectionName>: Opens the Health Summary page. | |||
| <EntityKey> | Specifies the level of the asset hierarchy for which you want to view health information. | Any Entity Key that corresponds to an asset in the asset hierarchy. | N/A |
| 0 | Displays the Home level of the asset hierarchy. | ||
| <SectionName> |
Specifies the type of health information you want to view. | indicator | Displays the Indicators section. |
| event | Displays the Events section. | ||
| policy | Displays the Policies section. | ||
| risk | Displays the Risks section. | ||
| health/indicator/<IndicatorEntityKey>/<WorkspaceName>: Opens the Health Indicator page. | |||
| <IndicatorEntityKey> | Specifies the health indicator whose details you want to view. | Any Entity Key that corresponds to a health indicator in the asset hierarchy. | N/A |
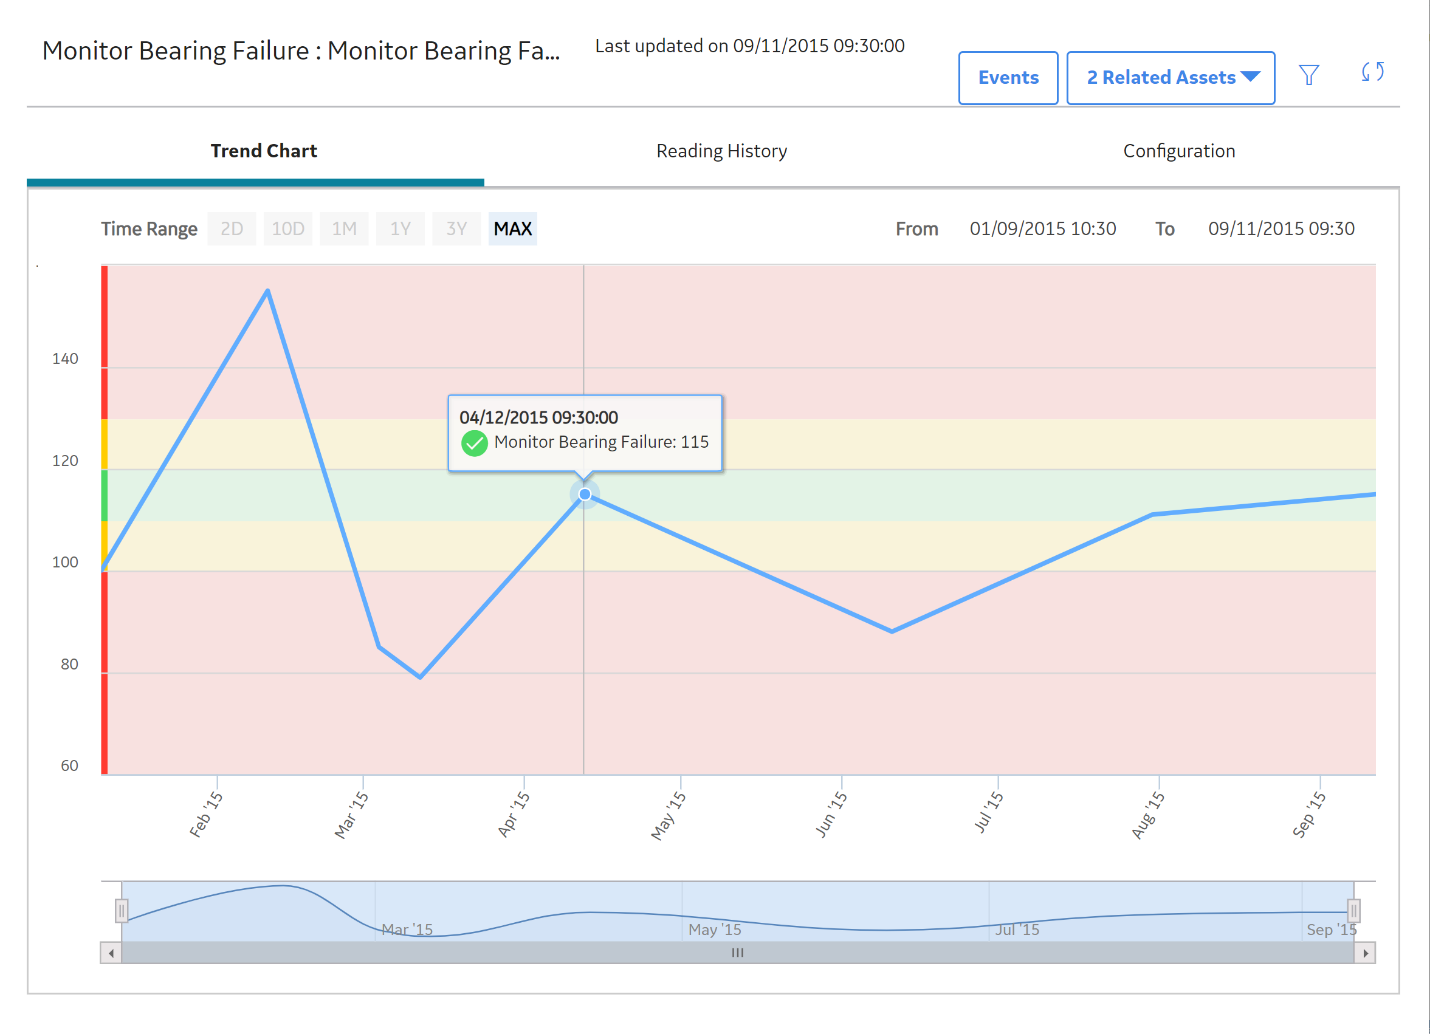
| <WorkspaceName> | Specifies the type of health indicator information you want to view. | trend | Displays the Trend Chart workspace. |
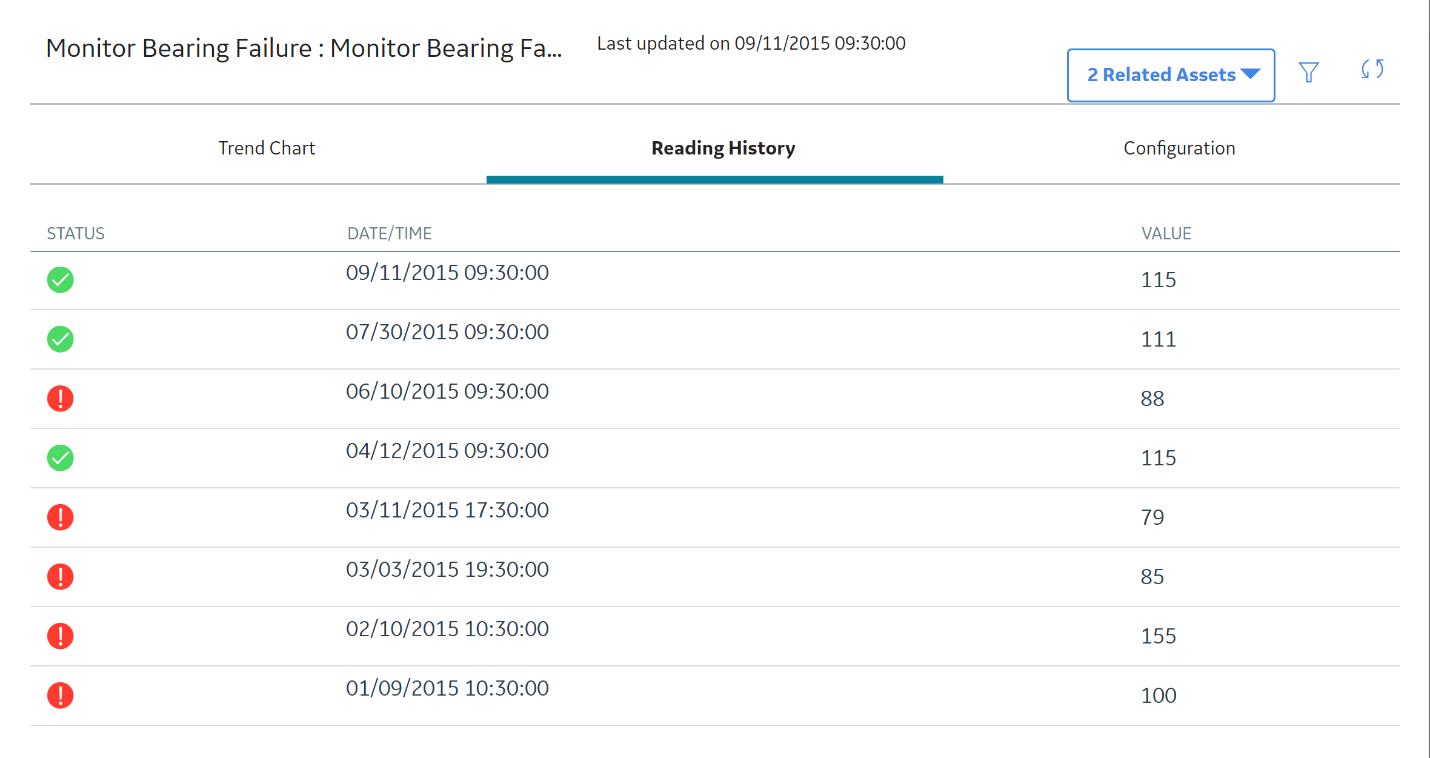
| readings | Displays the Reading History workspace. | ||
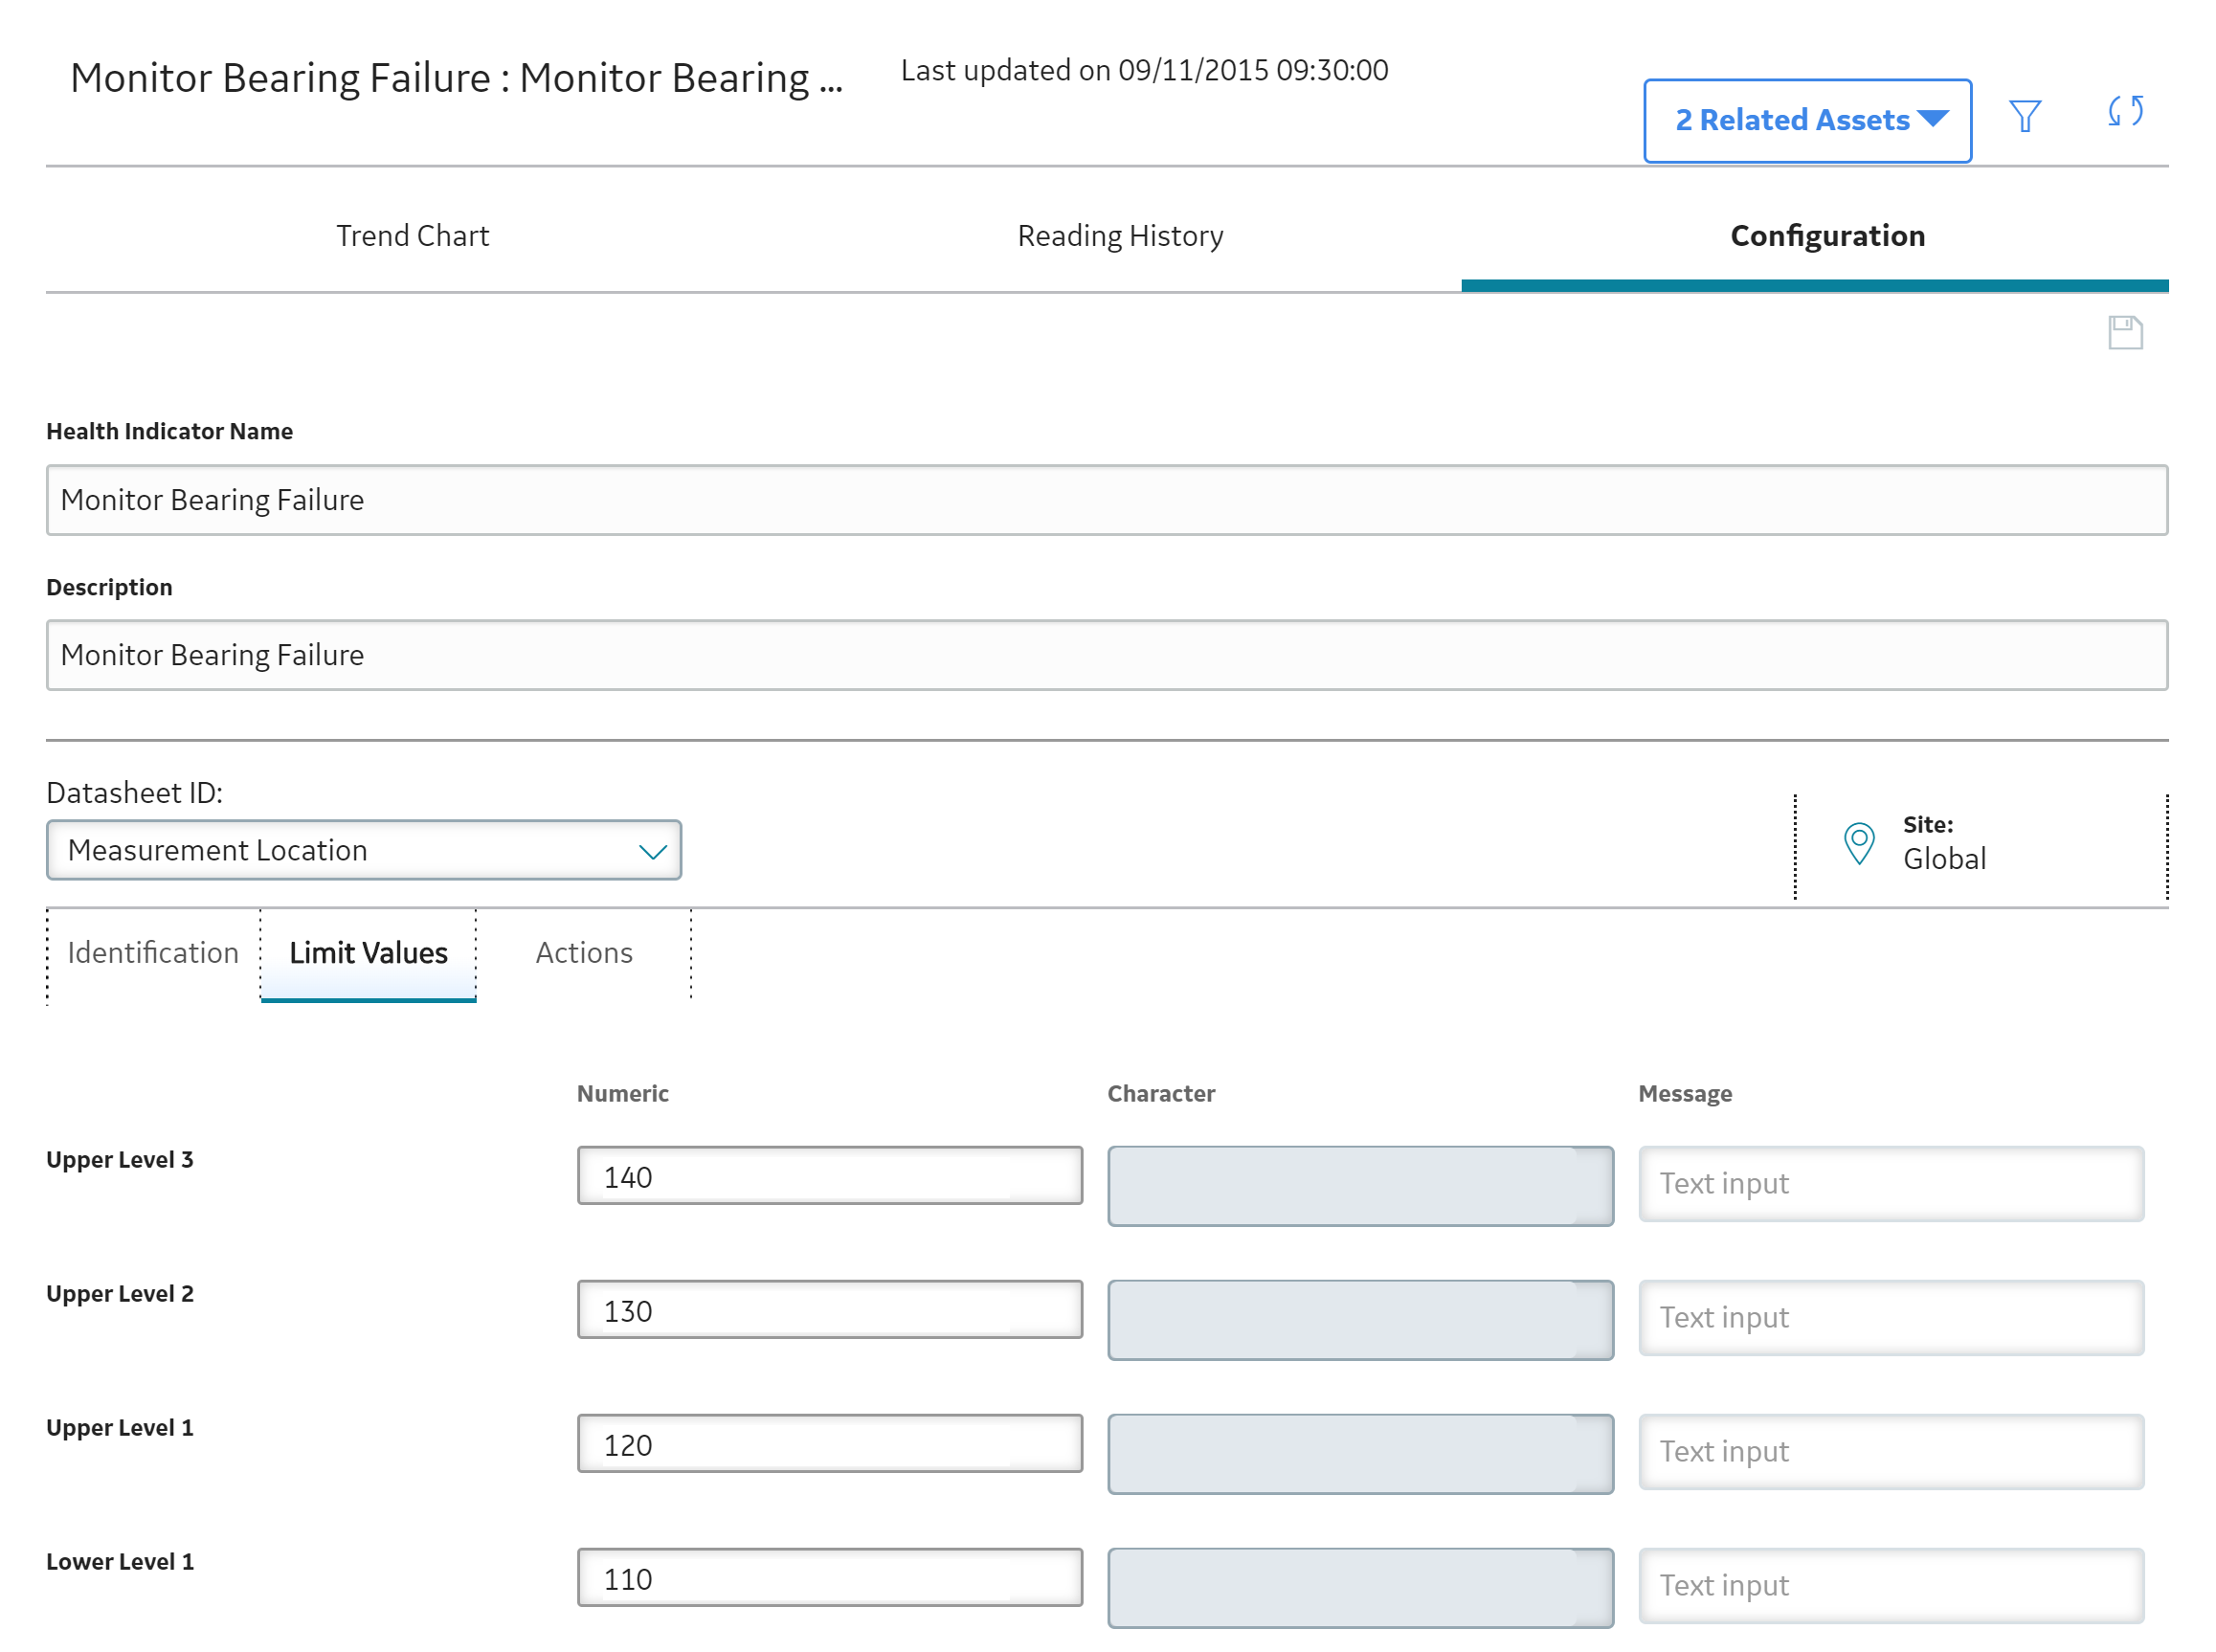
| configuration | Displays the Configuration workspace. | ||
Example URLs
| Example URL | Destination |
|---|---|
|
#health -or- #health/asset/0/indicator | The Indicators section of the Health Summary page for the Home level of the Asset Hierarchy. |
| #health/asset/6425187457/policy | The Policies section of the Health Summary page for the specified asset. |
| #health/indicator/64253092336/trend | The Health Indicator page, displaying a graph of readings associated with the specified health indicator. |
| #health/indicator/64253092336/configuration | The Health Indicator page, displaying source information for the specified health indicator. |
AHM System Code Tables
The following table lists the System Code Tables that are used by Asset Health Manager.
| Table ID | Table Description | Function |
|---|---|---|
| MI AHM STATUS | Health Indicator Status | Populates the Alert Level field in Health Indicator records. |
| MI AHM TIME | AHM Search Time Range | Populates the Time Range list in the filter for the Asset Health Manager Overview page. |
| MI HIER ITM GROUP | Hierarchy Item Groups | This table is no longer used. |
Access Health Indicator Details
Acknowledge Alerts and Warnings
Procedure
Results
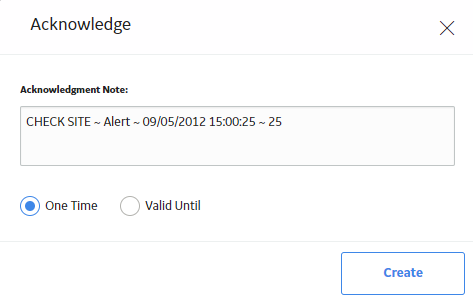
The  icon is added to the Acknowledgment column to indicate that the status of the health indicator will count as normal until a new reading is added or until the acknowledgment expires, depending on your selection.
 .
.