
 Operations Hub
Trend Chart Overview
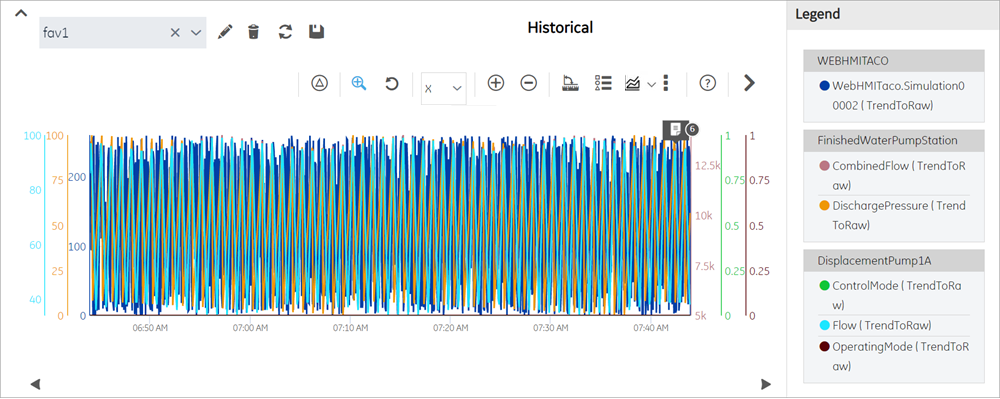
The trend chart allows you to plot real time data from OPC UA servers and historical data from Historian servers. You can plot the data using the context of a model or browse for a Historian or OPC UA server. You can then add tags to the chart.
The model contains asset types and assets. The assets have properties associated with them, which are, in turn, associated with tags defined in Historian or OPC UA.
The following image shows an example of a trend chart.
| Task | Procedure |
|---|---|
| Access the properties used in a trend chart. | The properties used in a trend chart appear in the Legend section. |
| Show/Hide the plotted data | To display this option, select a property from the trend chart legend.
Use  to show or hide the data on the chart. to show or hide the data on the chart.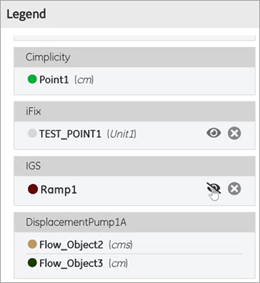 |
| Remove a property from the trend chart. | To delete plotted data from the trend chart, select the respective
property from the legend, then select  . . |
| Increase the area of a trend chart. |
|
| Pause the data flow of a trend chart. | This option is available only for the live mode.
|
| View the delta value between two data points. | The delta values for the trend is displayed in the
Legend section.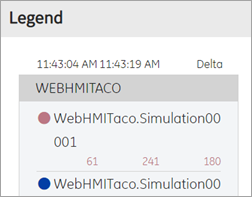 On the toolbar,
select |
| Display units on the Y-axis | If a source tag has engineering units, then the unit information
appears on the chart's y-axis, legend, and tooltip.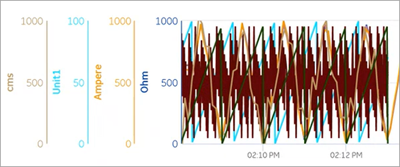 Units do not appear on a single y-axis. If you opted for a single y-axis configuration, the units appear only on the chart's legend and tooltip. |
| Drill down a trend chart. | On the toolbar, select  to drill down or zoom into a trend chart for more granular information.
To zoom out, select to drill down or zoom into a trend chart for more granular information.
To zoom out, select  . .
If you want to zoom in or zoom out a single axis, select the axis in
the drop-down list box next to If you want to enlarge
an area on the chart, select Data is re-fetched only in historical mode when zoomed in/out (changes chart start time/duration) of a chart. For example, consider trending 500 samples from 1-2pm, then zoom in to 1:00 - 1:10pm to request 500 samples data for that 10 minute span. |
| Pan across a trend chart. | You must zoom in/out of a chart to be able to pan across a trend chart.
The pan icon is enabled when you perform the zoom operation. The pan icon is visible only in the Live mode.
In Historical mode:
|
| Mark a trend chart view as favorite. It is an easy way to view the trend chart for commonly used configuration settings. | On the toolbar, select  , enter a name for the
view, and then select Add. , enter a name for the
view, and then select Add. 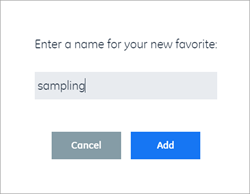 Important: Special characters To load a
favorite view, select the view from the drop-down list box next to ? / \ # ; % are not
supported. Do not include them in your favorite name..
You can also access the list of saved favorites while creating application pages in Operation Hub. Under Trend Card widget properties, select a favorite chart view from Select Favorite drop-down list. The selected view loads by default when you launch the trend chart at runtime. |
| View the statistics of tags plotted on a trend chart. | On the toolbar, select  to show/hide the statistical data for Historian
tags used in the trend chart. The statistics appear below the chart. to show/hide the statistical data for Historian
tags used in the trend chart. The statistics appear below the chart.In historical mode, tag statistics are re-fetched on zooming in/out (changes chart start time/duration) of a chart. |
| Trend Card | This is the default chart type. There are three chart types:
You can access other chart types from the trend chart toolbar. 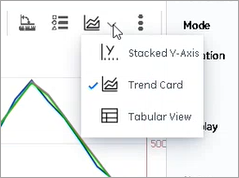 |
| Stacked Y-axis | On the toolbar, select Stacked Y-Axis to stack
multiple charts. For example, if you choose to trend four tags, the chart
appears with a common x-axis and a stacked y-axis. With a stacked y-axis,
you can:
Note:
|
| Tabular View | On the toolbar, select Tabular View to display
data in a table format.
|
| Export the trend chart data. | The trend chart data is exported and saved as a CSV file. On the
toolbar, select  ,
then select ,
then select  to export
data. to export
data.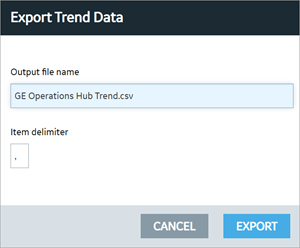 |
| Print a trend chart. | On the toolbar, select , then select  . .You have the option to provide a title that
appears above the trend chart. 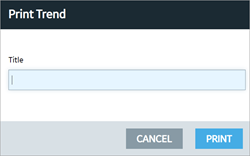 |
| Reset the trend chart options. | On the toolbar, select , then select  . Any changes you have made to the duration,
start time, axis preferences, and properties are reverted. . Any changes you have made to the duration,
start time, axis preferences, and properties are reverted. |
| Scroll through the historical data. | Select  and and  to move back and forth
in the chart, and access historical data. Scrolling back and forth changes
the start time for the chart. to move back and forth
in the chart, and access historical data. Scrolling back and forth changes
the start time for the chart.For example, if you are currently viewing trends during 1-2pm, you can scroll back in time to view 12:45-1:45pm, then return to current view. |
 to pause trending.
 .
. , and select the
two data points whose delta value you want to view.
, and select the
two data points whose delta value you want to view.Recommendations While Using a Trend Chart
- When you add a trend chart to a page using the page designer, use separate containers for the breadcrumb and the chart. For the trend chart, set the height to 100%.
- When accessing a trend chart on a mobile device:
- Use a device with medium to high resolution.
- Use the device in landscape mode.
- To print a trend chart using an Android device, use the screen capture feature rather than selecting .
- Configure the trend chart using a desktop rather than an Android device. This is because when you attempt to search for an asset or a Historian tag on an Android device, the in-built keyboard of the device appears, which may not allow you to enter the search criteria.
- When you view the delta between two data points, the value may not be clearly readable on a mobile device with low to medium resolution. Therefore, we recommend that you view the delta value on a desktop or a mobile device with high resolution.
- When you view statistical data, the trend chart area may be limited. To avoid this issue, plot up to two properties on the trend chart.
- To pan across the trend chart or drill down the trend chart on an iPad, use the Zoom feature of the iPad rather than selecting
 , , or , respectively.