KPI Benchmarking Analysis
About KPI Benchmarking Analysis
Using the KPI Benchmarking Analysis feature in Operations Performance Management, you can leverage the KPI analytical data to compare the performance of the assets, processes, and plants within an enterprise. This helps you to objectively identify high and low performing assets and take appropriate action to optimize performance across the enterprise.
For example, if your enterprise has multiple plants for which you want to analyze and improve the operational efficiency, you can create multiple KPI analytic to measure the efficiency (for example, throughput, wastage, cost to serve, first time right) and deploy them across your enterprise at various levels such as plants and assets. You can then use KPI Benchmarking Analysis to compare the performance of each plant against a specific KPI. Then, based on your analysis, you can make decisions to improve the efficiency at a plant. Decisions include implementing the best practices of high performing plants in low performing plants, shifting production to high performing plants, and other operational adjustments.
Access a KPI Benchmarking Analysis Template
About This Task
Procedure
- To update an analysis, perform the following steps:
- Select
 , and then select Update Template.The modified KPI Benchmarking Analysis template is saved.
- Select
Use Analysis to Perform KPI Benchmarking Analysis
Plot the output tags generated by a KPI analytic using the APM Analysis module.
Before You Begin
- You must be logged in to an OPM tenant with access to the APM Analysis module.
- To plot KPI tags, you must deploy at least one analytic whose Primary Category value is set to KPI in the Spark runtime for the assets that you want to analyze.
- To plot the forecast data for a KPI analytic, the analytic must be configured to write the forecast data to the same output tag that is used to write the observed data for the analytic.
About This Task
Procedure
- In the page, in the drop-down options for selecting views, select New Benchmark Analysis. A new benchmark analysis page appears, displaying the following sections:
- KPI BROWSER
- PLOTTED TAGS
- KPI DETAILS
The page also contains the date range selectors for the analysis. By default, the date range selected for the analysis is from 15 days prior to the current date to the current date.Tip: Next to the date range, you can select to view the calendar, and then modify the date range for which the charts are plotted. You can plot forecast data up to 30 days from the current date.
 - To plot the performance of a KPI, perform the following steps:
- Drag the selected asset to the chart area.Note: In the KPI BROWSER section, if the
 icon appears next to the asset name, it indicates that the asset has an associated deployment for the KPI. The
  icon next to the asset name indicates that the asset does not have an associated deployment for the KPI and you cannot plot a chart for the asset.In the page, a chart representing the performance of the asset, computed using the KPI analytic deployment, appears. In the chart, a solid line is used to represent historical data, a dotted line is used to represent forecast data, and a vertical line is used to represent the current date. In the KPI BROWSER section, the asset for which you plotted the chart is highlighted. Below the KPI BROWSER section, the PLOTTED TAGS section appears, displaying a list of tags for which data has been plotted. In the PLOTTED TAGS section, next to each tag listed, a circular marker that indicates the color used to plot the chart for the tag.
- Drag the selected asset to the chart area.
- As needed, repeat step 4 to plot more analytic deployments.Note:
- You can plot a maximum of five deployments for analysis.
- You can only plot data for deployments measuring the same KPI. For example, if you have plotted data for a deployment that computes throughput, you cannot plot a deployment that computes the cost to serve in the same analysis. In the KPI BROWSER section, when you plot the first KPI deployment, selection of deployments for an unrelated KPI is disabled.
- You can only plot data for deployments associated with assets of the same asset classification. For example, if you have plotted data for a deployment associated with an asset that is classified as a two-wheeler, you cannot plot data for a deployment associated with an asset classified as a four-wheeler. Similarly, if you have plotted data for a deployment at the site level, you cannot plot data for a deployment at the segment level.
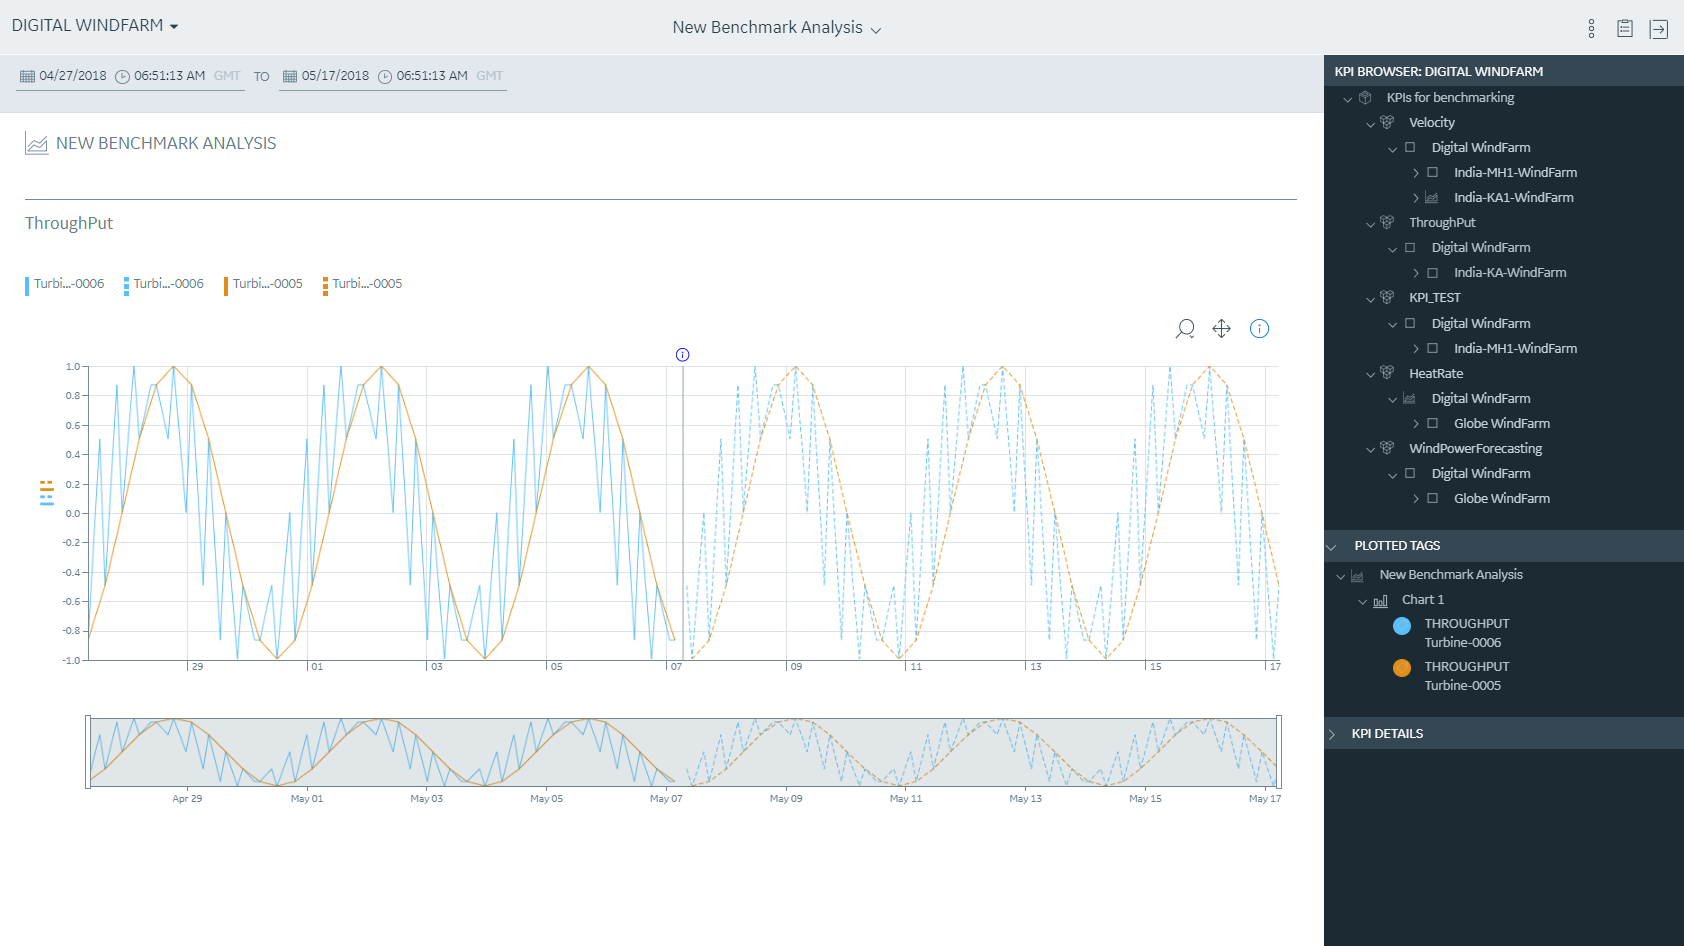
The following image shows an analysis of the performance of two assets based on the KPI ThroughPut.
- Select , and then select Save as New Template.
Results
- In the page, the charts for the deployments that have been plotted appear. You can hover over the charts to view the details of the data points plotted.
- Above the charts, a legend listing the color associated with each deployment that has been plotted and the name of the plotted deployment appear.
Modify the Colors used for the Plotted Charts
You can customize the charts plotted for the deployment tags by modifying the colors used for plotting the charts.
Procedure
- In the PLOTTED TAGS section, hover over the tag for which you want to modify the color used for the chart.Next to the tag name, the
 button and the
  button appear.
 - Next to the tag name, select .A window appears, displaying a color palette.
Remove the Chart for a Plotted Tag
This topic describes how to remove a chart for a plotted tag.
Procedure
- In the PLOTTED TAGS section, hover over the tag whose chart you want to remove from the Kpi Benchmark Analysis section.Next to the tag name, the button and the button appear.
- Next to the tag name, select .The chart for the tag is removed from the page. In the KPI BROWSER section, the KPI deployment for the tag that you removed is enabled for selection.Note: If you remove all the tags from the PLOTTED TAGS section, all KPIs in the KPI BROWSER section are enabled for selection.
Delete a KPI Benchmarking Analysis Template
Procedure
- Select , and then select Delete Template.The template is deleted.
Structure of the KPI Browser
The KPI BROWSER section contains a list of KPIs that have been deployed in the selected asset level and in the levels within the selected level. For example, if you selected a site in the Context Browser, then all KPIs deployed in the selected site, in segments within the site, and in the assets within the segments are listed. For each KPI, the hierarchy of assets within the selected level are listed in a tree structure.
- KPI
- Enterprise
- Site
- Segment or Plant
- Asset
- Segment or Plant
- Site
- Enterprise
For a KPI, the tree structure contains a list of assets only up to the hierarchy level at which an analytic for the KPI is deployed. The hierarchy levels above the listed assets may or may not have a deployed analytic for the KPI. In the KPI Browser, if the icon appears next to the asset name, it indicates that the asset has an associated deployment for the KPI. The icon next to the asset name indicates that the asset does not have an associated deployment for the KPI and you cannot plot a chart for the asset. You can drill-down the nodes in the tree to navigate to the asset for which you want to plot the chart.
Example Structure of KPI Browser
The following image shows an example of the KPI BROWSER section.
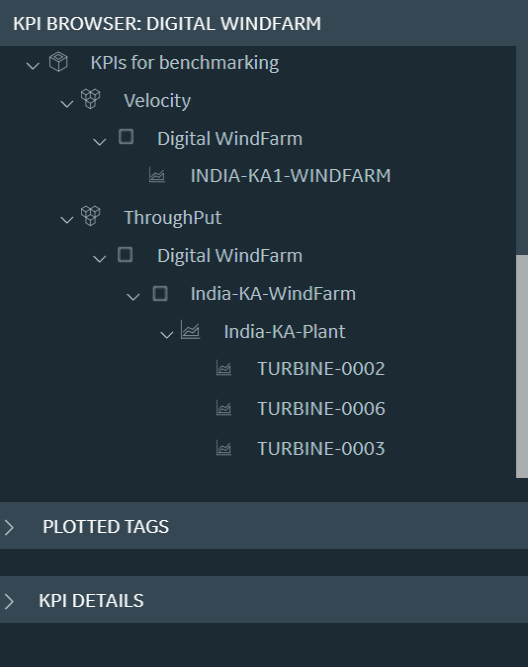
In the example, the selected asset level, Digital WindFarm, is an enterprise. Velocity and ThroughPut are KPIs that have been deployed in one or more asset levels within Digital WindFarm.
For the KPI ThroughPut, the hierarchy of assets is listed up to the asset level. The three assets listed in the tree structure for ThroughPut, indicate that a KPI analytic for ThroughPut has been deployed for these assets. In the levels above the three assets (that is, the plant, site, and enterprise), the plant India-KA-Plant contains an associated KPI analytic deployment. The site and enterprise level assets do not contain an associated deployment for ThroughPut.
For the KPI Velocity, only the assets up to site level are listed, indicating that the segments and assets within Digital WindFarm do not have an associated KPI analytic for the KPI Velocity. The KPI analytic for Velocity has been deployed at the site level. The enterprise asset does not have an associated deployment for Velocity.