You can access the Thickness Monitoring Overview page only if you are a member of one of the following Security Groups:
MI Thickness Monitoring Administrator
MI Thickness Monitoring Inspector
MI Thickness Monitoring User
You can perform the various tasks on this page based on the privileges granted to these Security Groups.
Steps
On the top navigation bar, select .
The Asset Hierarchy page appears.
In the left pane, navigate to the hierarchy level for which you want to access the Thickness Monitoring Overview page.
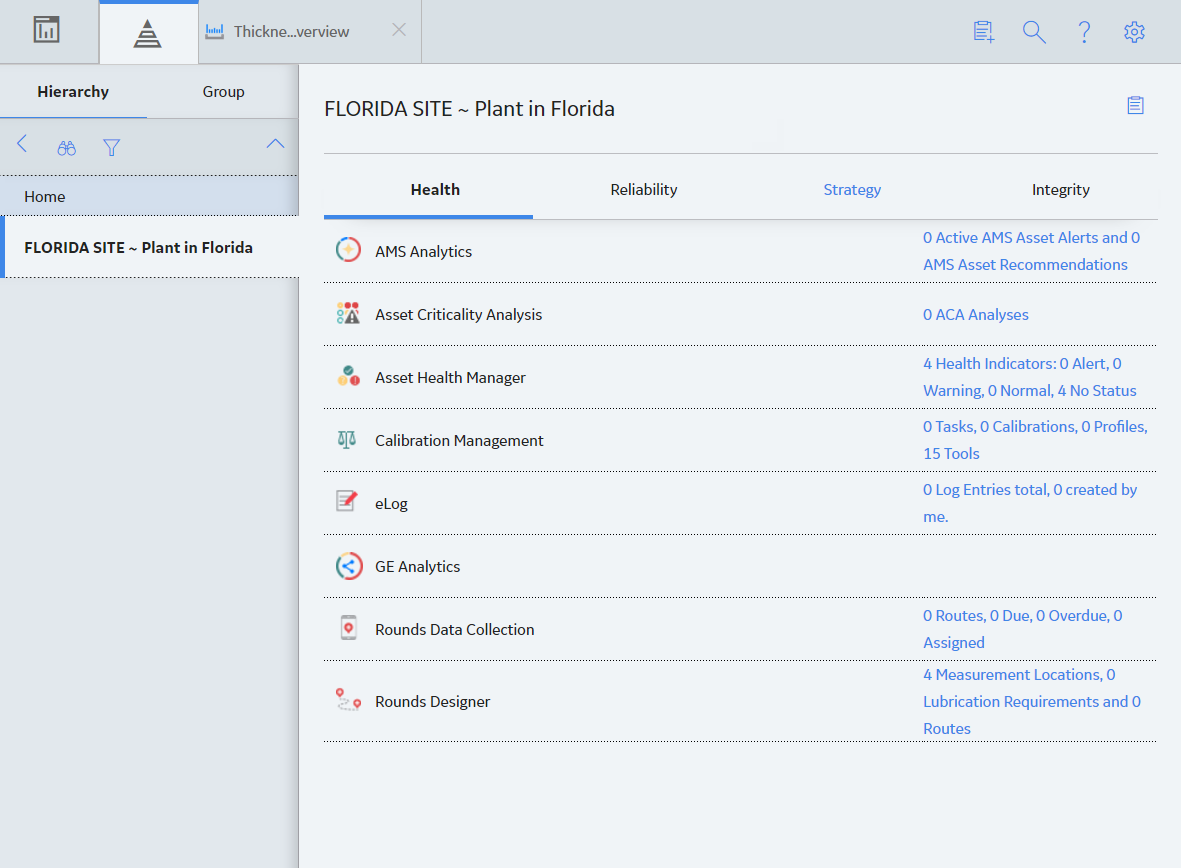
A list of types of analyses performed on assets in the selected hierarchy level appears in the workspace, in the Health section.
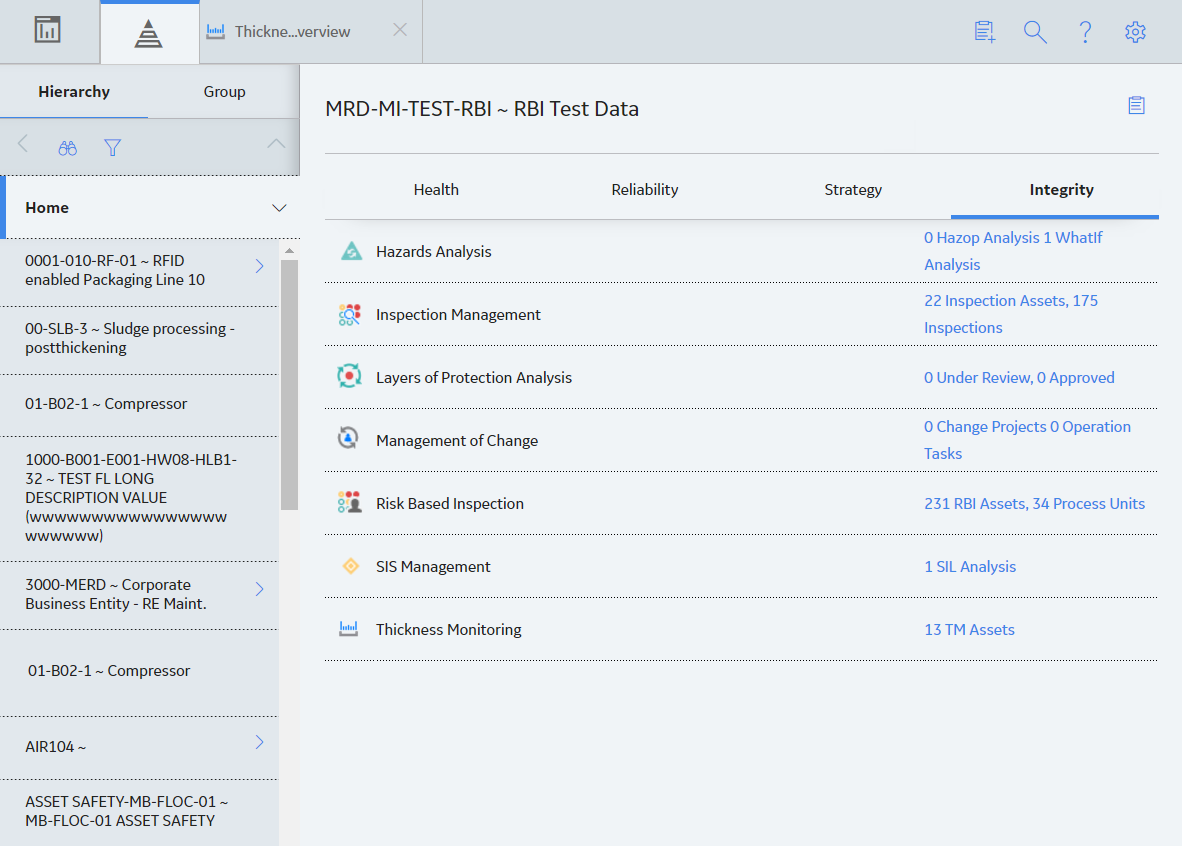
In the workspace, select the Integrity tab.
The Integrity section appears, displaying a list of the functions performed on the selected hierarchy level.
Select the link in the Thickness Monitoring row.
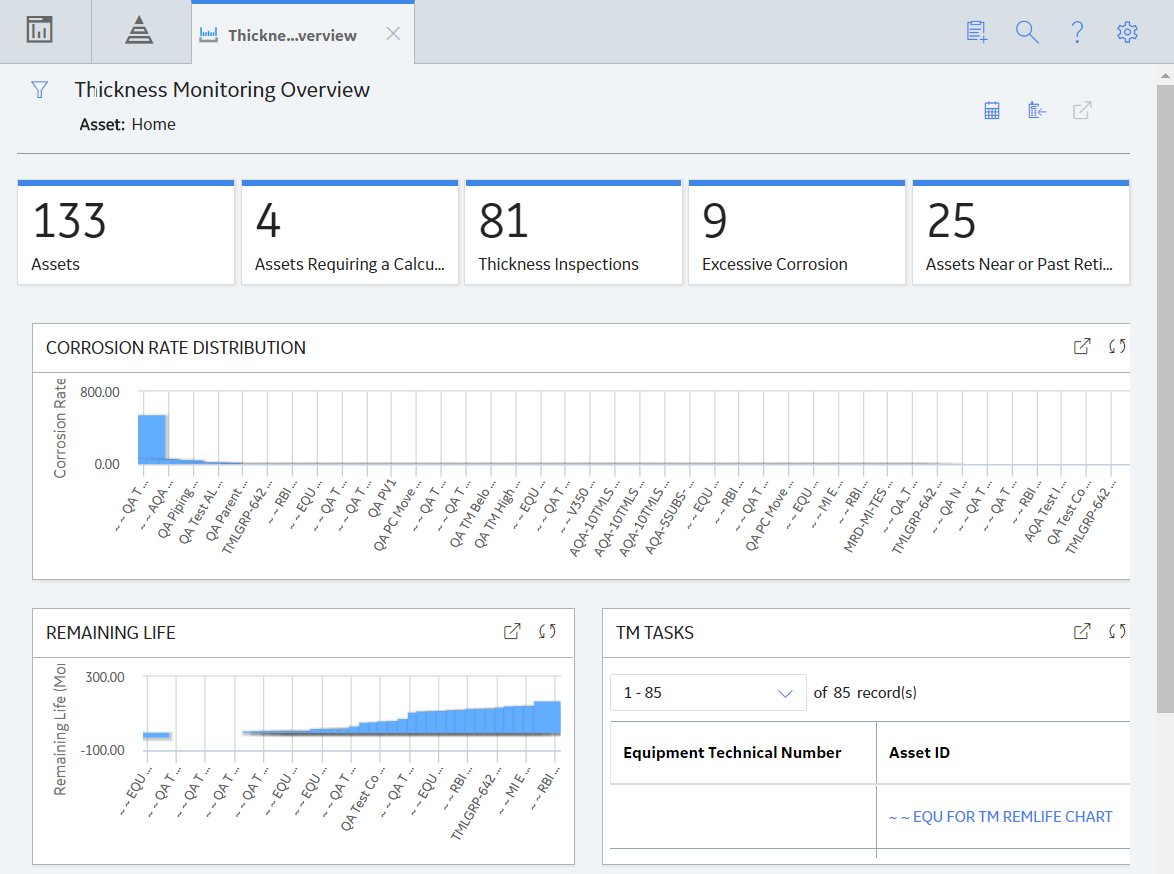
The Thickness Monitoring Overview page appears, displaying the following information that corresponds only to the selected hierarchy level.
Note: If you have selected an asset instead of a hierarchy level (i.e, functional location), then instead of the Thickness Monitoring Overview page, the TM page appears, displaying the Corrosion Analysis Settings workspace.
The Corrosion Rate Distribution graph: Plots the corrosion rate values of assets.
The Remaining Life graph: Plots the remaining life values of assets.
The TM Tasks section: Displays a list of Thickness Monitoring tasks, sorted by the value in the Next Date field.
The Degradation Distribution section: Displays a list of Degradation Mechanisms and RBI Analyses linked to each asset.
The Assets section: Displays a list of Equipment and Functional Locations in the selected hierarchy level that are linked to Corrosion Analysis Settings. If you want to include an asset in this list, you will first need to create Corrosion Analysis Settings for that asset. If you have loaded data using the Thickness Monitoring (TM) Data Loaders, then this list is updated to display the assets that have been added or updated via the data loader workbook.
The Assets Requiring a Calculation section: Displays a list of assets that have not been calculated. If you have loaded data using the Thickness Monitoring (TM) Data Loaders, then this list is updated to display the assets that have been added or updated via the data loader workbook.
The Thickness Inspections section: Displays the asset controlling next inspection date specified in a Thickness Inspection linked to each asset.
The Excessive Corrosion section: Displays the controlling corrosion rate values of assets with high rates of corrosion.
The Assets Near or Past Retirement section: Displays a list of assets that are near or past retirement.
Optionally, if you have configured Thickness Monitoring to link Functional Locations directly with TMLs and TML Groups, in the upper-right corner of the workspace, you can select to open the Functional Location in the Analysis Overview workspace.