Access the Analysis Overview workspace for the asset or TML Group that contains the Remaining Life graph that you want to access.
In the workspace, select the Remaining Life tab.
The Remaining Life section appears, displaying the following information:
- The remaining life graph: Displays a pie chart of the remaining life (in years) of the TMLs linked to the selected asset or TML Group.
- The remaining life table: Displays a list of TMLs, along with their remaining life values and the IDs of the associated assets. This list is filtered based on your selection on the graph. If you want to view a list of all the TMLs in the TML Group or Asset, then select Clear Filter.
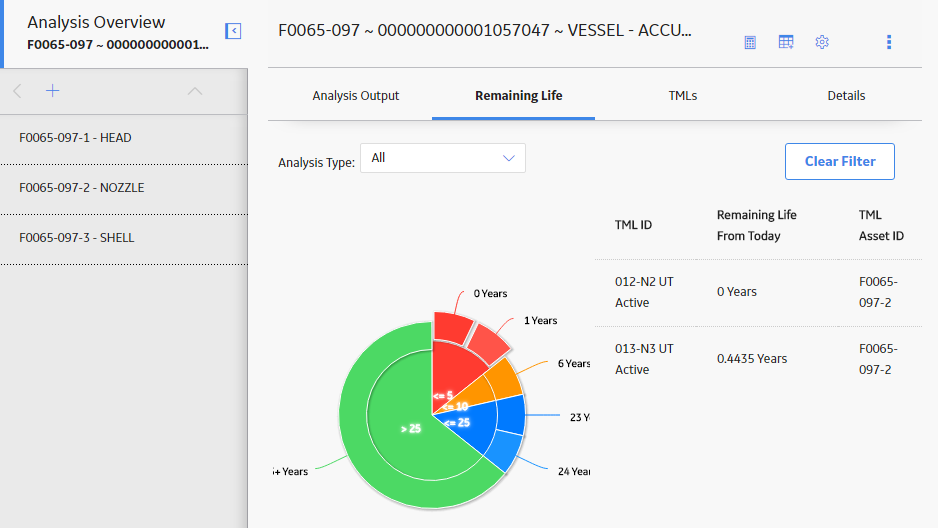
Tip: By default, the graph is plotted for TMLs associated with all analysis types. You can, however, filter the graph by selecting an analysis type in the Analysis Type box.