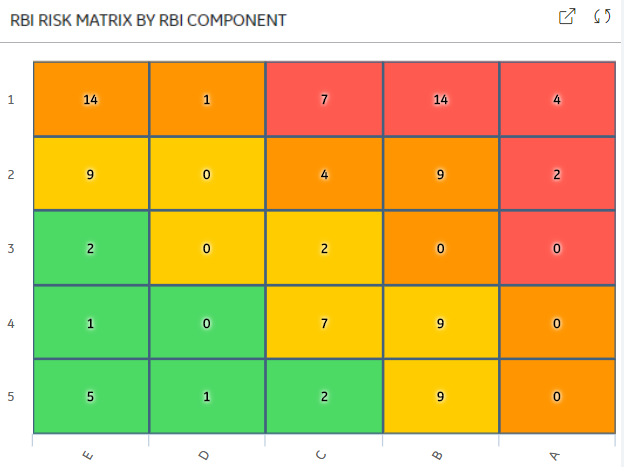
The RBI RISK MATRIX BY RBI COMPONENT graph on the Risk Based Inspection Overview page plots the total number of components based on their consequence of failure and probability of failure values. A component is considered while plotting the graph only if the component is linked to an active RBI Criticality Analysis, RBI PRD Criticality Analysis, or RBI Pipeline Analysis.
The color of each cell in the graph is based on the risk category, as described in the following table.
| Risk Category | Color |
|---|---|
| Low | Green |
| Medium | Yellow |
| Medium High | Orange |
| High | Red |
If you pause over a cell on the graph, the probability of failure and consequence of failure values appear, along with the number of components whose consequence of failure and probability of failure match the value in the cell. If you select the cell, the RBI Risk Matrix page appears, displaying a list of components that meet the aforementioned criteria, along with their equipment details, inspection priority, risk category, consequence of failure, and probability of failure values.
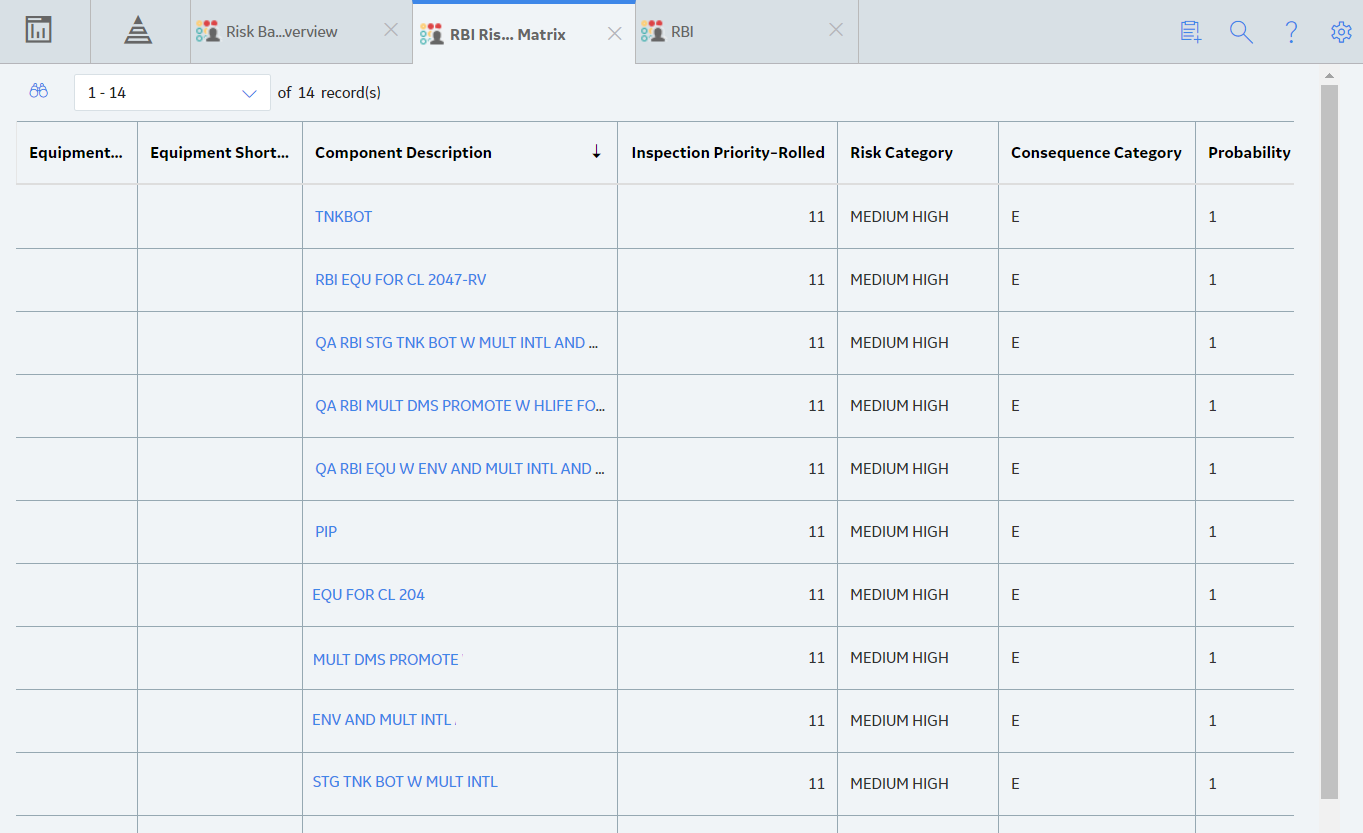
You can access a component in the list by selecting the hyperlink in the Component Description column.
Copyright © 2018 General Electric Company. All rights reserved.