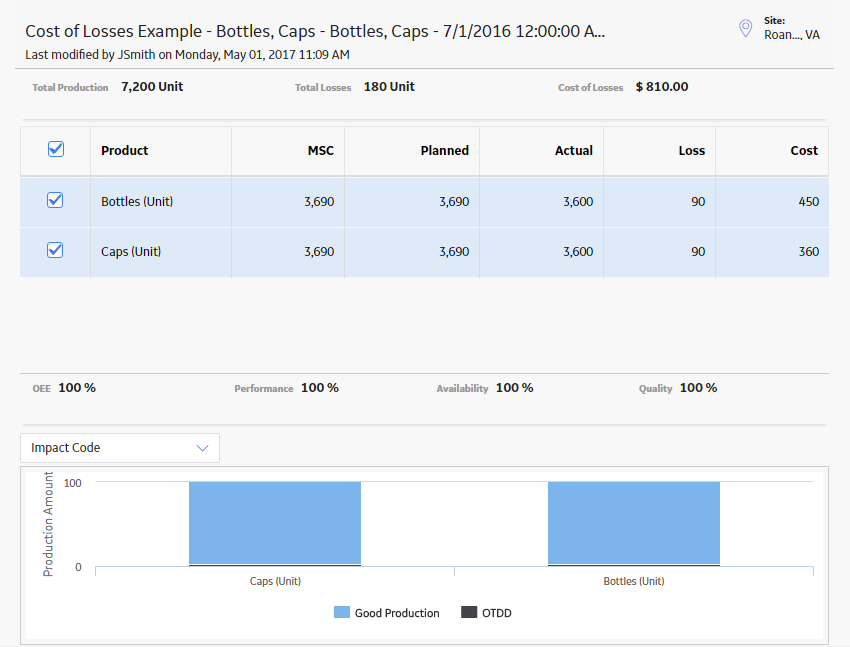
The following example explains the calculation of Cost of Losses for a two products, Bottles and Caps. This value will appear in the Cost column in Production Summary workspace.
Consider the following table, which indicates the values that exist in the Period, Losses, and Margin fields in Production Data records for one product, Bottles. You can see that all of the records contain the same value in the Losses field and in the Margin field. Based on the formula to calculate Cost of Losses per day, the cost of losses per day for each is shown in the Cost of Losses column. In the last row, you can see the Total Cost for all days in the plan for Bottles. This value is displayed in the Cost column in the Production Summary workspace.
| Period | Losses | Margin | Cost of Losses Equation | Cost of Losses |
|---|---|---|---|---|
| 7/1/2016 | 10 | 5 | (10 x 5) | 50 |
| 7/2/2016 | 10 | 5 | (10 x 5) | 50 |
| 7/3/2016 | 10 | 5 | (10 x 5) | 50 |
| 7/4/2016 | 10 | 5 | (10 x 5) | 50 |
| 7/5/2016 | 10 | 5 | (10 x 5) | 50 |
| 7/6/2016 | 10 | 5 | (10 x 5) | 50 |
| 7/7/2016 | 10 | 5 | (10 x 5) | 50 |
| 7/8/2016 | 10 | 5 | (10 x 5) | 50 |
| 7/9/2016 | 10 | 5 | (10 x 5) | 50 |
| Total Cost | 450 | |||
Now, consider the following table, which indicates the values that exist in the Period, Losses, and Margin Value fields in Production Data record for second product, Caps. You can see that all of the records contain the same value in the Losses field and in the Margin field Based on the formula to calculate Cost of Losses per day, the cost of losses per day for each is shown in the Cost of Losses column. In the last row, you can see the Total Cost for all days in the plan for Caps. This value is displayed in the Cost column in the Production Summary workspace.
| Period | Losses | Margin | Cost of Losses Equation | Cost of Losses |
|---|---|---|---|---|
| 7/1/2015 | 10 | 4 | (10 x 4) | 40 |
| 7/2/2015 | 10 | 4 | (10 x 4) | 40 |
| 7/3/2015 | 10 | 4 | (10 x 4) | 40 |
| 7/4/2015 | 10 | 4 | (10 x 4) | 40 |
| 7/5/2015 | 10 | 4 | (10 x 4) | 40 |
| 7/6/2015 | 10 | 4 | (10 x 4) | 40 |
| 7/7/2015 | 10 | 4 | (10 x 4) | 40 |
| 7/8/2015 | 10 | 4 | (10 x 4) | 40 |
| 7/9/2015 | 10 | 4 | (10 x 4) | 40 |
| Total Cost | 360 | |||