The Risk Profile chart that appears on the Strategy Details page shows only the Active and Unmitigated risk ranks, whereas the Risk Analysis shows the Proposed risk rank data, allowing you to compare the Active Strategy and the Proposed Strategy.
Note: The Risk Profile chart does not display Risk records that have been removed from the Proposed Strategy.
Risk Rank
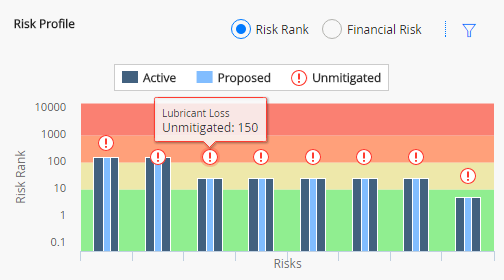
The following image shows an example of a Risk Profile chart from the Risk Analysis section of a strategy, displaying the Risk Rank graph.
The Risk Rank graph contains the following elements:
- Unmitigated Risk Rank: The values for the unmitigated risk rank for each Risk in the Active Strategy are signified by
 .
. - Proposed Mitigated Risk Rank: The values for the projected/proposed Strategy Mitigated Risk Rank value for each Risk that belongs to the Proposed Strategy are displayed on the light-blue vertical bar. As you make changes to the Asset Strategy, changing the strategy's state to Modified, those changes are reflected in the bars on the graph.
- Active Risk Rank: The Strategy Mitigated Risk Rank value for each Risk that belongs to the Active Strategy. These values are displayed on the dark-blue vertical bars on the graph.
Note: If a Proposed Strategy contains more Risks than the corresponding Active Strategy, the additional Risks are displayed on the Risk Profile chart. For any additional Risk, the unmitigated risk rank and the active risk rank will be the same until the strategy is activated.
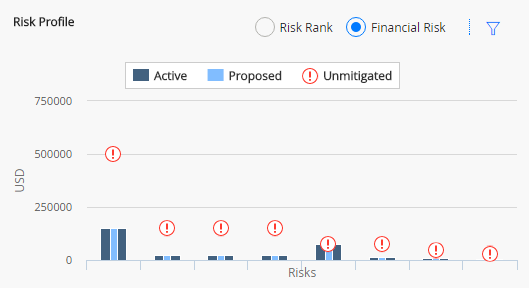
Financial Risk
You can use the radio buttons on the Risk Profile (Risk Profile) chart to toggle between the Risk Rank graph and the Financial Risk graph. As seen below, the Financial Risk graph shows the financial risk of each asset in the strategy.
The risks are shown on the x-axis, while the y-axis contains a monetary amount in US Dollars (USD) for the following scenarios, which appear in the following chart.
- Unmitigated: The risks presented with no changes.
- Active: The risks as they are in an active strategy.
- Proposed: The risks as proposed with changes to the strategy.
Manipulating the Risk Rank and Financial Risk Charts
You can select

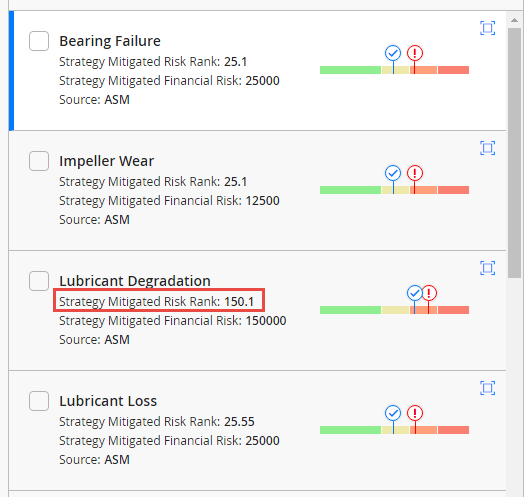
For example, consider the following graph, which shows the total mitigated risk, 150.1, for Lubricant Degradation across all risk categories.
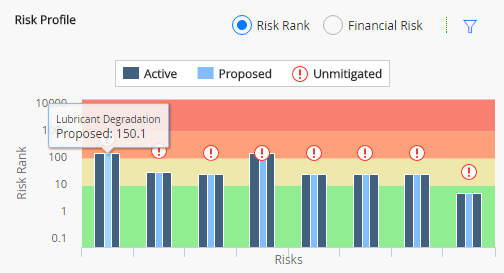
You would also see this value on the action card for Strategy Mitigated Risk Rank, accessed via the Risks and Actions page in your Asset Strategy.
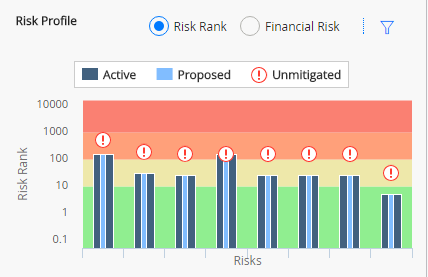
If you filtered the Risk Profile section to display only risk values associated with the Operations risk category, it would look like the graph in the following image.
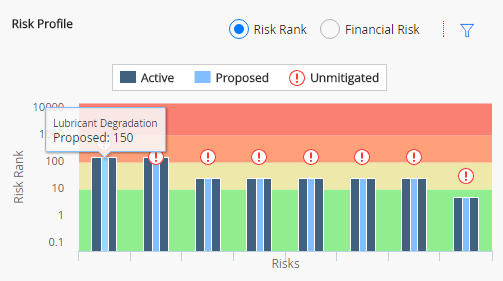
If you place the cursor over the line and the bars, you can choose to show the datapoint values on the graph to determine the exact risk rank values. The following image displays the example graph with the cursor hovering over the unmitigated risk bar for Lubricant Loss.