This topic provides an example of ASO analyses to explain how ASO analyses are created and used.
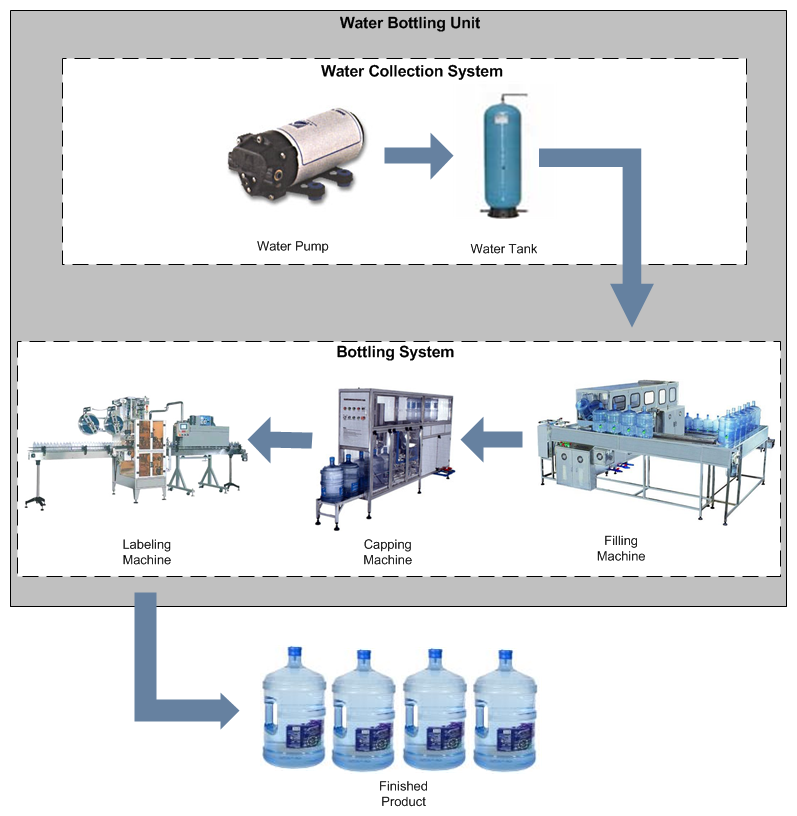
This ASO analysis example involves a water bottling facility. The water bottling facility is a unit, labeled the Water Bottling Unit. This unit contains two systems: Water Collection System and Bottling System. Each system contains equipment that work together to complete a single process.
The Water Collection System contains the following equipment:
The Bottling System contains the following equipment:
The unit, systems, and equipment and the process in which they are involved are illustrated in the following image.
An ASO analysis begins with an asset strategy, system strategy, or unit strategy. Our ASO analysis example includes the following strategies, where the indentation of the bullets indicates the structure of the strategies:
Note: For this example, each asset strategy has an active strategy and a proposed strategy that are different from one another.
The following image shows the records and links that are used to create the association between the Unit Strategy, one of its System Strategies, one of its Asset Strategies (Water Pump Strategy), and the Asset Strategy's Action and Risk records.

The following image illustrates existing records and links after the ASO Analysis is created. The colors in the image have the following meanings:

Asset Data
The Equipment record Water Pump contains the following values:
Asset Strategy Data
The Asset Strategy record that is linked to the Equipment record Water Pump contains the following values:
Active Strategy
Action Data
The following table shows the example data stored in the Action records that are linked to the Active Strategy record with the ID Water Pump Strategy.
| Action | Values |
|---|---|
| Redesign Impellers |
Name: Redesign Impellers Action Type: Redesign (DSM) Interval: 2 Interval Units: Years Nonrecurring: Yes Cost: 1,600 Shutdown Required: Yes |
| Replace Seals | Name: Replace Seals Action Type: Time-Based Maintenance (Preventative) (PM) Interval: 2 Interval Units: Years Nonrecurring: No Cost: 2,000 Shutdown Required: Yes |
| Vibration Analysis | Name: Vibration Analysis Action Type: Condition-Based Maintenance (Predictive) (CM) Interval: 3 Interval Units: Weeks Nonrecurring: No Cost: 0 Shutdown Required: No |
Risk Data
The following table shows the example data stored in the Risk records (and the corresponding Risk Assessment records) that are linked to the Active Strategy record with the ID Water Pump Strategy. It also shows which Action records represent actions that mitigate the risk.
| Risk | Risk Values | Mitigating Action Values |
|---|---|---|
| Seal Failure |
Name: Seal Failure Unmitigated Risk Rank: 150.6 Unmitigated Financial Risk: 690.00 |
Name: Replace Seals
Mitigated Risk Rank: 3.6 Mitigated Financial Risk: 230.00 |
| Bearing Failure | Name: Bearing Failure
Unmitigated Risk Rank: 306 Unmitigated Financial Risk: 1,080.00 |
Name: Vibration Analysis
Mitigated Risk Rank: 3.6 Mitigated Financial Risk: 360.00 |
| Impeller Failure | Name: Impeller Failure
Unmitigated Risk Rank: 156 Unmitigated Financial Risk: 165.00 |
Name: Replace Seals
Unmitigated Risk Rank: 1.5 Unmitigated Financial Risk: 55.00 |
Proposed Strategy
Action Data
The following table shows the example data stored in the Action records that are linked to the Proposed Strategy record with the ID Water Pump Strategy.
Note: Values that differ from the values in the corresponding Action record that is linked to the Active Strategy record are colored red.
| Action | Values |
|---|---|
| Redesign Impellers |
Name: Redesign Impellers Action Type: Redesign (DSM) Interval: 3 Interval Units: Years Nonrecurring: Yes Cost: 1,800 Shutdown Required: Yes |
| Replace Seals | Name: Replace Seals Action Type: Time-Based Maintenance (Preventative) (PM) Interval: 2 Interval Units: Years Nonrecurring: No Cost: 1,500 Shutdown Required: Yes |
| Vibration Analysis | Name: Vibration Analysis Action Type: Condition-Based Maintenance (Predictive) (CM) Condition Monitoring Type: Periodic Interval: 4 Interval Units: Weeks Nonrecurring: No Cost: 0 Shutdown Required: No |
Risk Data
The following table shows the example data stored in the Risk records (and the corresponding Risk Assessment records) that are linked to the Proposed Strategy record with the ID Water Pump Strategy. It also shows which Action records represent actions that help mitigate the risk.
Note: Values that differ from the values in the corresponding Risk record that is linked to the Active Strategy record are colored red.
| Risk | Risk Values | Mitigating Action Values |
|---|---|---|
| Seal Failure |
Name: Seal Failure Unmitigated Risk Rank: 150.6 Unmitigated Financial Risk: 690.00 |
Name: Replace Seals Mitigated Risk Rank: 3.6 Mitigated Financial Risk: 225.00 |
| Bearing Failure |
Name: Bearing Failure Unmitigated Risk Rank: 306 Unmitigated Financial Risk: 1,080.00 |
Name: Vibration Analysis Mitigated Risk Rank: 3.2 Mitigated Financial Risk: 360.00 |
| Impeller Failure |
Name: Impeller Failure Unmitigated Risk Rank: 306 Unmitigated Financial Risk: 165.00 |
Name: Replace Seals Unmitigated Risk Rank: 1.5 Unmitigated Financial Risk: 55.00 |
Active Scenario
Action Data
The following table shows the example data that is used in the Actions that are defined for the Water Pump Strategy and belong to the Active Scenario. Because the Active Scenario always reflects data that was mapped from ASM and these values cannot be changed, this table includes only the values that are specific to ASO and were not mapped from ASM.
| Action | Mitigated Risk | Source | Values |
|---|---|---|---|
| Redesign Impellers | Impeller Failure | System Special Action |
Duration: 2 Duration Units: Weeks Replace Failure Consequence: Yes Replace TTF Distribution: Yes |
| System Risk Assessment | Mitigated Unplanned Correction Cost: 1000^1 | ||
| Weibull |
Name: New TTF Distribution Distribution Type: Weibull Time Unit: Months Beta: 4 Eta: 48 Gamma: 0 |
||
| Replace Seals | Seal Failure | System Preventive Maintenance |
Duration: 1 Duration Units: Days |
| Vibration Analysis | Bearing Failure | System Inspection |
Duration: 1 Duration Units: Hours Detection Probability (%): 90 |
Risk Data
The following table shows the example data that is used in the Risks that are defined for the Water Pump Strategy and belong to the Active Scenario. Note that this table includes only the values that are specific to ASO and were not mapped from ASM.
| Risk | Mitigating Action | Source | Values |
|---|---|---|---|
| Seal Failure | Replace Seals | System Risk |
Last Failure: 1/1/1999 12:00:00 AM Fixed Unplanned Correction Cost: 1500 Variable Unplanned Correction Cost: 1000 Variable Unplanned Correction Cost Units: Per Day Planned Correction Cost: 1000 Planned Correction Duration: 12 Planned Correction Duration Units: Hours Is Active: Yes Is Latent: No Failure Without Replacement: No Number of Subcomponents: 1 PF Interval: 30 PF Interval Units: Days Repair Immediately: Yes Percentage of PF Interval to Wait (%): 0 |
| Weibull |
Name: TTF Distribution Distribution Type: Weibull Time Unit: Years Beta: 4 Eta: 3 Gamma: 0 Enable Distribution Association: No |
||
| Normal |
Name: TTR Distribution Distribution Type: SingleValue Time Unit: Hours Value: 12 Enable Distribution Association: No |
||
| Bearing Failure | Vibration Analysis | System Risk | Last Failure: 1/1/1999 12:00:00 AM
Fixed Unplanned Correction Cost: 2000 Variable Unplanned Correction Cost: 1000 Variable Unplanned Correction Cost Units: Per Day Planned Correction Cost: 1000 Planned Correction Duration: 4 Planned Correction Duration Units: Hours Is Active: Yes Is Latent: No Failure Without Replacement: No Number of Subcomponents: 1 PF Interval: 6 PF Interval Units: Weeks Repair Immediately: Yes Percentage of PF Interval to Wait (%): 0 |
| Exponential | Name: TTF Distribution
Distribution Type: Exponential Time Unit: Months Value: 60 Enable Distribution Association: No |
||
| Exponential | Name: TTR Distribution
Distribution Type: Exponential Time Unit: Hours MTTR: 8 Enable Distribution Association: No |
||
| Impeller Failure | Redesign Impellers | System Risk | Last Failure: 1/1/1999 12:00:00 AM
Fixed Unplanned Correction Cost: 1500 Variable Unplanned Correction Cost: 1000 Variable Unplanned Correction Cost Units: Per Day Planned Correction Cost: 1000 Planned Correction Duration: 4 Planned Correction Duration Units: Hours Is Active: Yes Is Latent: No Failure Without Replacement: No Number of Subcomponents: 1 PF Interval: 0 PF Interval Units: Days Repair Immediately: Yes Percentage of PF Interval to Wait (%): 0 |
| Exponential | Name: TTF Distribution
Distribution Type: Exponential Time Unit: Months Value: 24 Enable Distribution Association: No |
||
| Normal | Name: TTR Distribution
Distribution Type: SingleValue Time Unit: Hours Value: 12 Enable Distribution Association: No |
Proposed Scenario
Action Data
The following table shows the example data that is used in the Actions that are defined for the Water Pump Strategy and belong to the Proposed Scenario. Because you can change the values that were originally mapped from ASM to a Proposed Scenario, this table includes the values that are specific to ASO and those that were mapped from ASM. In our example, however, we have not changed these values from their original ASM values. To distinguish between the two types of values, values that were mapped from ASM are colored gray in the table.
| Action | Mitigated Risk | Source | Values |
|---|---|---|---|
| Redesign Impellers | Impeller Failure | System Special Action |
Name: Redesign Impellers Action Type: Redesign (DSN) Action Cost: 1600 Interval: 2 Interval Units: Years Duration: 1.5 Duration Units: Weeks Shutdown Required: Yes One Time Action: Yes Replace Failure Consequence: Yes Replace TTF Distribution: Yes |
| System Risk Assessment | Mitigated Unplanned Correction Cost: 1000^1 | ||
| Weibull |
Name: New TTF Distribution Distribution Type: Weibull Time Unit: Months Beta: 4 Eta: 48 Gamma: 0 |
||
| Replace Seals | Seal Failure | System Preventive Maintenance |
Name: Replace Seals Action Type: Time-Based Maintenance (Preventive) (PM) Action Cost: 2000 Interval: 2 Interval Units: Years Duration: .5 Duration Units: Days Shutdown Required: Yes One Time Action: No |
| Vibration Analysis | Bearing Failure | System Inspection |
Name: Vibration Analysis Action Type: Condition-Based Maintenance (Predictive) (CM) Condition Monitoring Type: Periodic Action Cost: 0 Interval: 3 Interval Units: Weeks Duration: 1 Duration Units: Hours Shutdown Required: No One Time Action: No Detection Probability (%): 100 |
Risk Data
The following table shows the example data that is used in the Risks that are defined for the Water Pump Strategy and belong to the Proposed Scenario. Because you can change the values that were originally mapped from ASM to a Proposed Scenario, this table includes the values that are specific to ASO and those that were mapped from ASM. In our example, however, we have not changed these values from their original ASM values. To distinguish between the two types of values, values that were mapped from ASM are colored gray in the table.
| Risk | Mitigating Action | Source | Values |
|---|---|---|---|
| Seal Failure | Replace Seals | System Risk |
Name: Seal Failure Last Failure: 1/1/1999 12:00:00 AM Fixed Unplanned Correction Cost: 1500 Variable Unplanned Correction Cost: 1000 Variable Unplanned Correction Cost Units: Per Day Planned Correction Cost: 1000 Planned Correction Duration: 8 Planned Correction Duration Units: Hours Is Active: Yes Is Latent: No Failure Without Replacement: No Number of Subcomponents: 1 PF Interval: 30 PF Interval Units: Days Repair Immediately: Yes Percentage of PF Interval to Wait (%): 0 |
| Weibull |
Name: TTF Distribution Distribution Type: Weibull Time Unit: Years Beta: 4 Eta: 3 Gamma: 0 Enable Distribution Association: No |
||
| Normal |
Name: TTR Distribution Distribution Type: SingleValue Time Unit: Hours Value: 12 Enable Distribution Association: No |
||
| Bearing Failure | Vibration Analysis | System Risk |
Name: Bearing Failure Last Failure: 1/1/1999 12:00:00 AM Fixed Unplanned Correction Cost: 2000 Variable Unplanned Correction Cost: 1000 Variable Unplanned Correction Cost Units: Per Day Planned Correction Cost: 800 Planned Correction Duration: 2 Planned Correction Duration Units: Hours Is Active: Yes Is Latent: No Failure Without Replacement: No Number of Subcomponents: 1 PF Interval: 6 PF Interval Units: Weeks Repair Immediately: Yes Percentage of PF Interval to Wait (%): 0 |
| Exponential |
Name: TTF Distribution Distribution Type: Exponential Time Unit: Months Value: 60 Enable Distribution Association: No |
||
| Exponential |
Name: TTR Distribution Distribution Type: Exponential Time Unit: Hours MTTR: 8 Enable Distribution Association: No |
||
| Impeller Failure | Redesign Impellers | System Risk |
Name: Impeller Failure Last Failure: 1/1/1999 12:00:00 AM Fixed Unplanned Correction Cost: 1500 Variable Unplanned Correction Cost: 1000 Variable Unplanned Correction Cost Units: Per Day Planned Correction Cost: 600 Planned Correction Duration: 3 Planned Correction Duration Units: Hours Is Active: Yes Is Latent: No Failure Without Replacement: No Number of Subcomponents: 1 PF Interval: 0 PF Interval Units: Days Repair Immediately: Yes Percentage of PF Interval to Wait (%): 0 |
| Exponential |
Name: TTF Distribution Distribution Type: Exponential Time Unit: Months Value: 24 Enable Distribution Association: No |
||
| Normal |
Name: TTR Distribution Distribution Type: SingleValue Time Unit: Hours Value: 12 Enable Distribution Association: No |
Copyright © 2018 General Electric Company. All rights reserved.