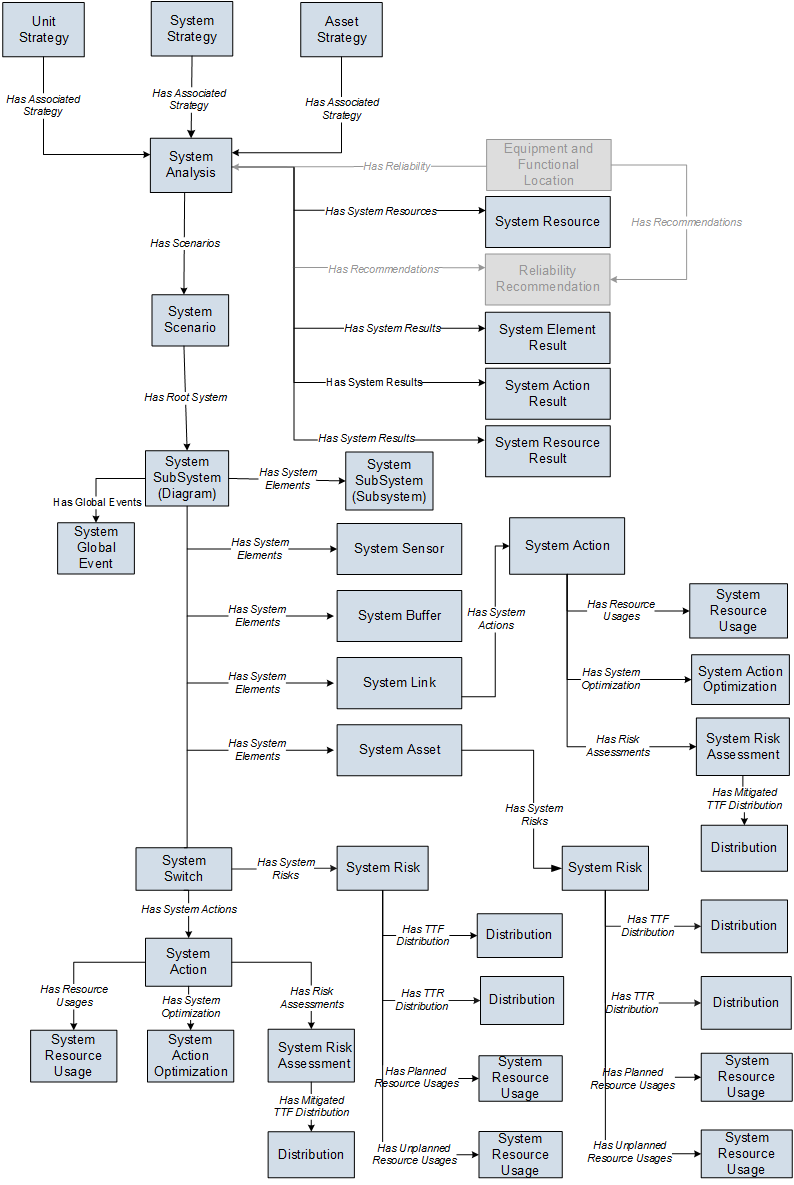
The following diagram illustrates how the families are related to one another within the ASO data model. Boxes and arrows represent entity families, relationship families, and associated relationship definitions. Note that in the following image:
While interpreting the image, note that:
The image contains two System SubSystem boxes because in an ASO Analysis, System SubSystem records serve two purposes:
They identify the Diagram. Each ASO Analysis contains only one Diagram, but per Scenario, the database contains two separate System SubSystem records to represent this Diagram. In other words, for each Scenario that exists in the analysis, the set of System SubSystem records that represent the Diagram is duplicated. So, for an analysis that contains only an Active Scenario and Proposed Scenario, four identical System Subsystem records will exist. Two of the records will be linked to the Active Scenario record, and two of them will be linked to the Proposed Scenario record. Whenever a change is made to the properties of the Diagram itself, the GE Digital APM system updates all System SubSystem records that represent the Diagram so that they are always identical.
Note: The GE Digital APM system creates two identical System subsystem records to represent the Diagram because the ASO and Reliability Analysis modules share code and in Reliability Analysis, each analysis can have multiple Diagrams.
They identify subsystems within the Diagram. In an ASO Analysis, the Diagram can contain multiple subsystems. Per Scenario, the database contains two separate System SubSystem records to represent a single subsystem in the Diagram. In other words, for each Scenario that exists in the analysis, the set of System SubSystem records that represent a subsystem within the Diagram is duplicated. So, for an analysis that contains only an Active Scenario and a Proposed Scenario, if the Diagram contains only one subsystem, four identical System SubSystem records will exist to represent this subsystem. Two of the records will be linked to the Active Scenario record, and two of them will be linked to the Proposed Scenario record. Whenever a change is made to the properties of the subsystem element via the Diagram, the GE Digital APM system updates all System SubSystem records that represent that subsystem so that they are always identical.
In other words, because each ASO Analysis must have an Active Scenario and a Proposed Scenario at all times, each ASO Analysis will contain at least four System SubSystem records, where these System SubSystem records represent the Diagram. Two of these records will be linked to the Active Scenario record, and two of them will be linked to the Proposed Scenario record. As additional Scenarios are created, other identical sets of System SubSystem records are created and linked to those Scenario records to represent the Diagram. In addition, if the Diagram includes subsystems, per Scenario, the ASO Analysis will contain two additional System SubSystem records to represent those subsystems.
The System SubSystem family is related to the System SubSystem family through the Has System Elements relationship. In the image, the System SubSystem box that contains the text Diagram in parentheses represents the Diagram. The System SubSystem box that contains the text Subsystem in parentheses represents subsystems within the Diagram. This distinction is made so that you can see that the System Global Event record is linked to the System SubSystem records that represents the Diagram.
Note: In ASO Analyses, all System SubSystem records are linked to the successor System Element records. The boxes are separated in the image only to clarify the Has Global Events relationship.
Copyright © 2018 General Electric Company. All rights reserved.