In the Analysis Summary pane, select the Diagram tab.
The Diagram workspace appears.
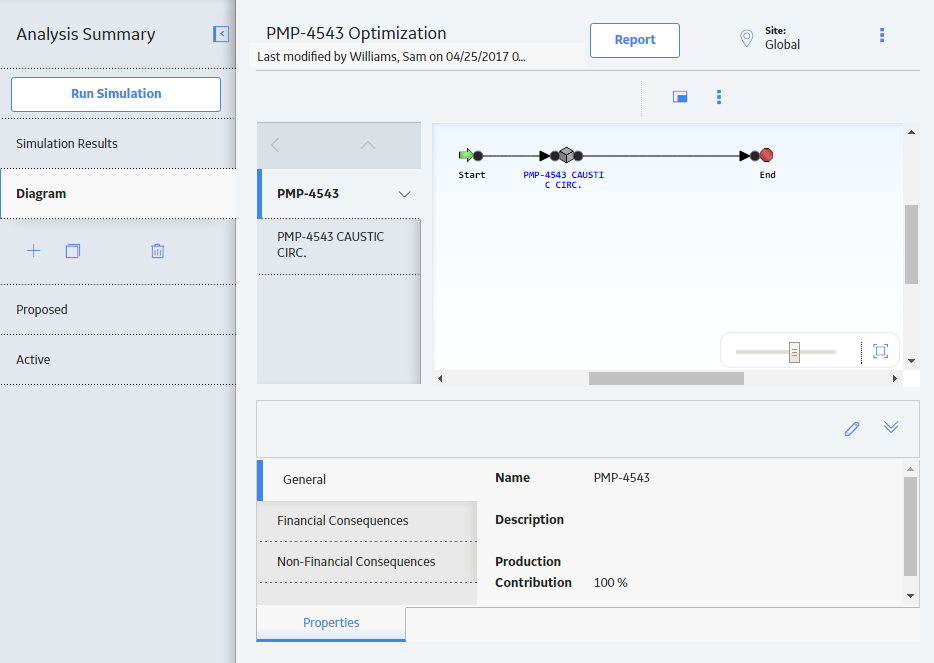
The Diagram workspace contains the following features:
-
Diagram Hierarchy pane: Provides a hierarchical view of the elements that are included in the Diagram.
-
Diagram Canvas: Serves as an interactive drawing interface where you can build a Diagram. You can drag elements from the Diagram Palette pane to the Diagram Canvas to display the elements within the Diagram. You can then rearrange the elements by dragging them to different locations on the Diagram Canvas.
-
Diagram Palette: Displays the available Diagram elements that you can drag onto the Diagram Canvas to include in the Diagram.
Note: The Diagram Palette feature is only available for System and Unit Strategies.
-
Properties: Displays the information associated either with the entire Diagram or a selected element.