Plotting Style Tab - Enhanced Chart Customization Dialog Box
The Plotting Style tab of the Enhanced Chart Customization dialog box displays the following items:
Line Style
|
Item |
Description |
|
Subset Selection List |
Allows you to select the data source that your Color, Point Type, Plotting Style, and Line Type selections will apply to. |
|
Colors |
Click to choose the desired color for the selected data source. Double-click a color button to define a custom color. |
|
Point Type |
Specifies the point type for the selected data source. NOTE: Point types appear in the chart only if the Chart Plotting Style includes points, such as Point + Line, for example. |
|
Line Type |
Specifies the line type for the selected data source. |
Chart Plotting Style
NOTE: The following styles are available only for Line/Multiline and XY Charts.
|
Item |
Description |
|
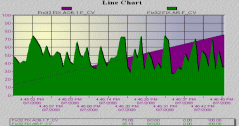
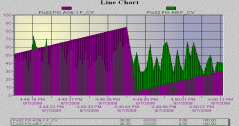
Area |
Specifies that the area under the plot line is filled
with the color selected in the Line Style area. |
|
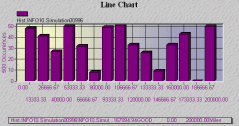
Bar |
Specifies that data is presented using bars. |
|
Histogram |
Specifies that data is presented in a histogram. NOTE: This style is not available for XY charts. The Histogram style is only valid for one data source. |
|
Line |
Specifies that data is presented using lines. NOTE: When two gapped sections surround a single valid data point, that isolated data point is plotted with a point even though the plotting style is currently a line. |
|
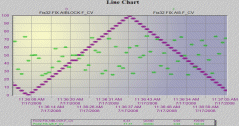
Points |
Specifies that data is presented using points. |
|
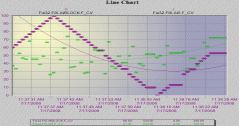
Point + Best Fit Curve |
Specifies that data is presented showing all data
points and plots a best fit curve for all points in the chart. |
|
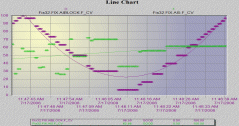
Point + Best Fit Curve II |
Specifies that data is presented showing all data
points and plots a best fit curve for only the currently visible points
in the chart. NOTE: This style is not available for XY charts. |
|
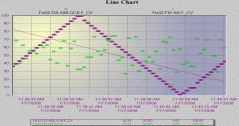
Point + Best Fit Line |
Specifies that data is presented showing all data
points and plots a best fit line for all points in the chart. |
|
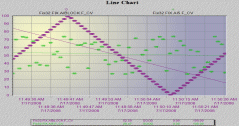
Point + Best Fit Line II |
Specifies that data is presented showing all data
points and plots a best fit line for only the currently visible points
in the chart. NOTE: This style is not available for XY charts. |
|
Point + Line |
Specifies that data is presented using points and
lines. |
|
Point + Spline |
Specifies that data is presented using points and
splines. |
|
Spline |
Specifies that data is presented using splines. |

Data Shadows
|
Item |
Description |
|
Off |
Specifies that there are no shadows for the chart data. |
|
Shadow |
Specifies that there are shadows for the chart data. NOTE: Shadows can be applied only to Line/Multiline charts that use Area or Bar for their Plotting Style and to Histograms. |
|
3D |
Specifies that the chart's data is 3D. NOTE: 3D can be applied only to Histogram charts. It does not work with SPC Bar charts or Line/Multiline charts. |
Export
Click to access the Exporting dialog box.
Snapshot
Click to get a maximized static snapshot of the chart, presented at full-screen size.