Using Mission Control to View AAM Statistics
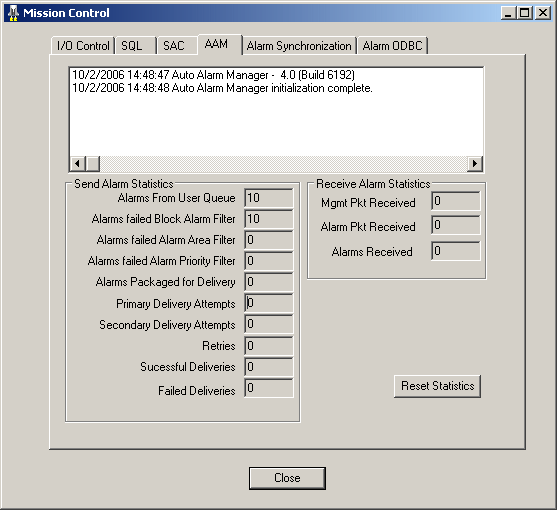
The Auto Alarm Manager statistics are displayed in Mission Control so that you can easily monitor the program's progress. Using the AAM tabbed page in Mission Control, you can view run-time messages and troubleshooting statistics in a scrollable window:

The lower portion of the tabbed page contains fields that the Auto Alarm Manager uses to display alarm statistics. As alarms are received from the user queue, the number of the alarms is displayed, and errors relating to the alarms are displayed in the remaining fields from top to bottom. These statistics can help you troubleshoot the sending and receiving of alarms. To reset the displayed values, click Reset Statistics.
Be aware that the Mission control AAM statistics apply to both:
- The Auto Alarm Manager running regularly with the RAS dial-up connection for alarm delivery.
- The Auto Alarm Manager running with Ethernet (TCP/IP) alarm delivery. This is accomplished using the command /L option when you start AAMTCP.exe. For more on the /L command line option, refer to the More on /L Using Ethernet (TCP/IP) Instead of RAS Dial-up for Alarm Delivery section.
For detailed descriptions of the fields in this window, refer to the Auto Alarm Manager Tabbed Page Fields section.
 To open Mission
Control:
- In Classic view, click the Mission Control button on the Application toolbar.
-Or-
In Ribbon view, on the Applications tab, in the Utilities group, click Mission Control.
-Or-
Select Mission Control from the iFIX WorkSpace system tree.
- Click the AAM tab.
NOTE: Before the Auto Alarm Manager can deliver alarms, both the Sending and the Receiving nodes must be running the Auto Alarm Manager and must have a modem attached and properly configured for dialing out (on Sender nodes) or accepting incoming connections (for Receiver nodes) using the TCP/IP protocol over RAS.


