Important: You do not have the latest version of Historian! You are missing out on the newest capabilities and enhanced security. For information on all the latest features, see the Historian product page. For more information on upgrades, contact your Proficy sales agent or e-mail Proficy Sales Support. For the most up-to-date documentation, go here.
Historian Statistical Analysis Sample Report
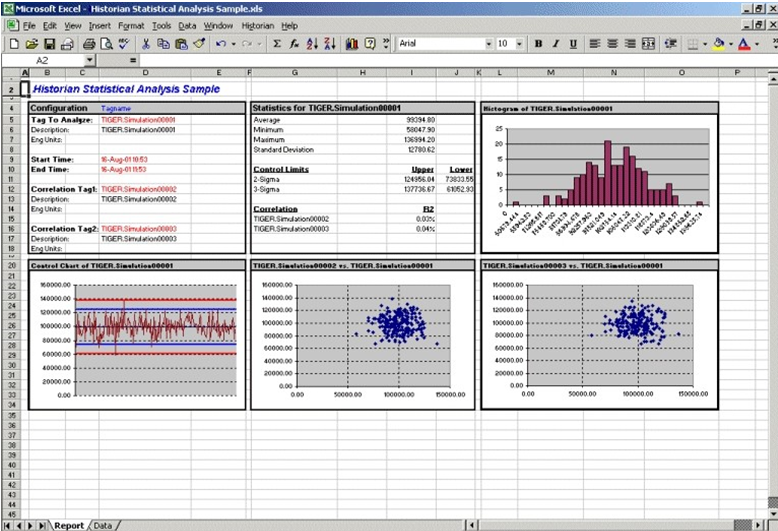
This report calculates, for a specified time period, a number of statistical properties of a tag, such as average, maximum, minimum, standard deviation, 2 sigma and 3 sigma control limits, and correlation coefficients for other tags. It displays charts of various types for several of these variables.
The chart at the lower left is a plot of the main variable vs. time with sigma control limits indicated by the straight lines. The two charts to the right are scatter diagrams that show the correlation between the main variable and two other variables. The chart at the top right is a histogram of data values of the main variable that shows how the data points are distributed.
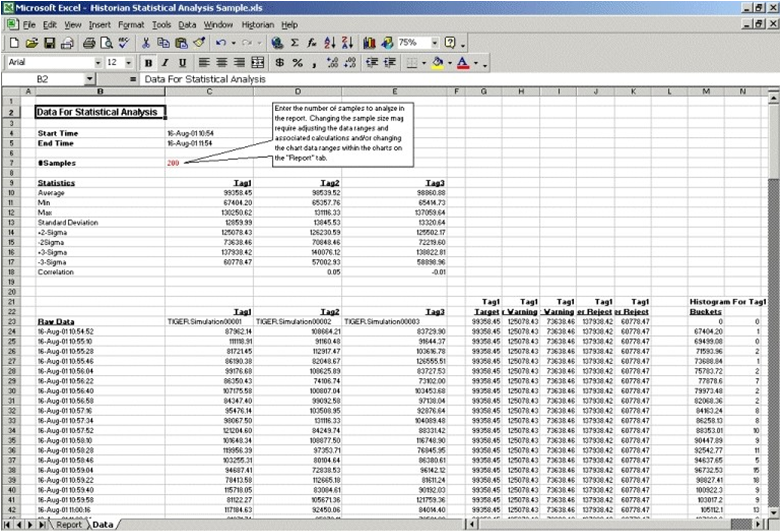
The following figure shows the worksheet associated with the sample report that contains the data used to generate the report.