Understand the Historian Interface
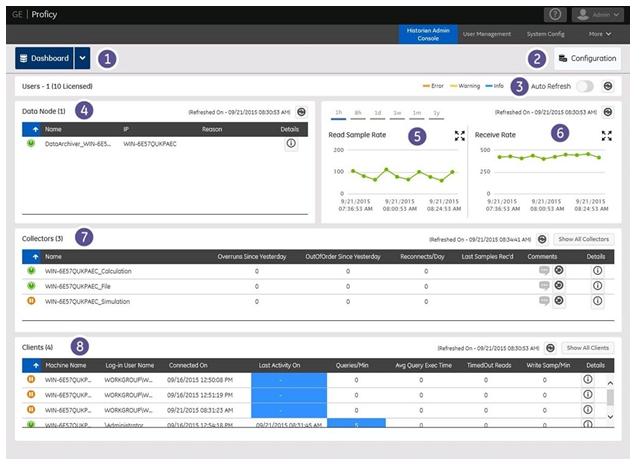
The main interface consists of several panels or windows and appears as shown in the following image:

The elements for this interface are defined as follows: | Number | Item | Description |
|---|---|---|
| 1 | Dashboard | This link at the top left of the screen opens the Historian Dashboard screen the one that you are currently viewing, which displays the overall picture of the system health. |
| 2 | Configuration | This link opens the Configuration panel. From there, you can view and modify the details of Collectors, Clients Services, Data Stores, Tags and Active Jobs. For more information, refer to the Configuration Panel topic. |
| 3 | Auto / Manual Refresh | If Auto Refresh is ON, then the screen is refreshed automatically. If Auto Refresh is OFF, then you can manually refresh the screen or the individual section of the dashboard by clicking the icon. |
| 4 | Data Node | This panel displays the basic information of the nodes (Primary Node & Mirror Nodes) currently available. To view the details of a particular node, click the Details button of the node. The Data Node screen appears. |
| 5 | Read Sample Rate | This panel gives you the trend of the average read sample rate across all archives in the data store per sample per minute. You can choose the time scales by clicking on the time options provided on the top right area of the screen. To scale the panel, click the icon. Receive Rate This panel gives you the trend of the recent rate at which the samples have been received per minute. You can choose the time scales by clicking on the time options provided on the top right area of the screen. To scale the panel, click the icon. |
| 6 | Collectors | This panel displays the details of all the unhealthy collectors connected to the system. To view the details of a particular collector, click the Details button. The Collector Detail Diagnostics dialog appears. To view all the collectors in the system click the Show All Collectors button. The Configuration Page appears. For more information on the collector panel, refer to the Collector Statistics topic. |
| 7 | Clients | This panels displays the client statistics of the top five read and write clients in the order of the load that they impose on the server. For more information, refer to the Client Statistics topic. |
| 8 | Color codes | The Error, Warning, and Information color codes are displayed based on the status of the Data Node, Collectors or Clients. |