Windows Performance Collector Configuration
Understanding Windows Performance Collector Tag Hierarchy
The Windows Performance Collector provides the ability to browse performance tags hierarchically. This hierarchy is different from the hierarchy of the Windows Performance Monitor.
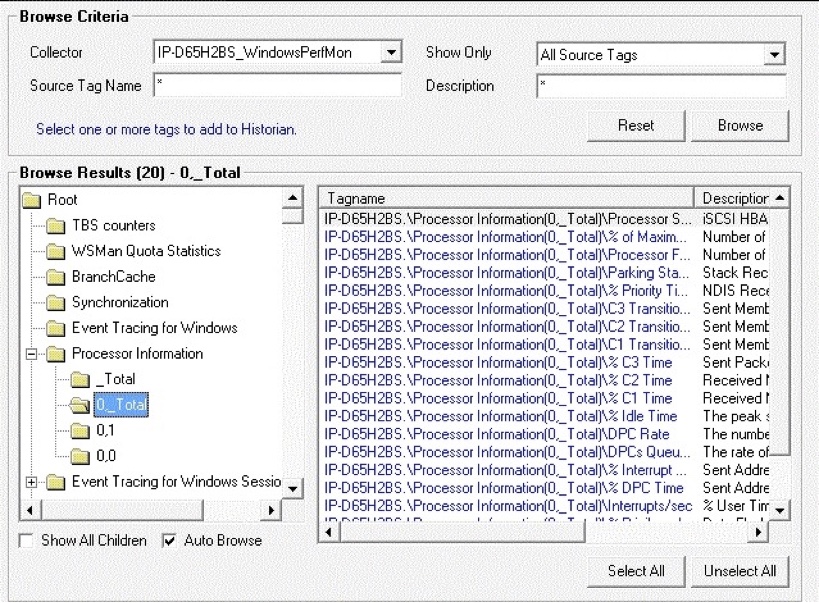
The Windows Performance Collector displays Objects, Instances, and Counters. When you click an Object, its Instances appear in a folder structure under the specific Object. The Objects are displayed as they are added. They are not displayed in an alphabetical order as they are created dynamically. The Counters are displayed on the right. If no counters exist for a particular Instance, they are not displayed.
The following figure provides an example of the hierarchy:
Figure: Windows Performance Collector Browse Criteria Screen

In the Windows Performance Collector, while you are collecting data, if any of the counters of any application or process stops running, the collector does not stop showing that particular instance but will continue running it with zero values for that particular Counter. It does not update these counters dynamically.
Configuration Tab for Windows Performance Collector
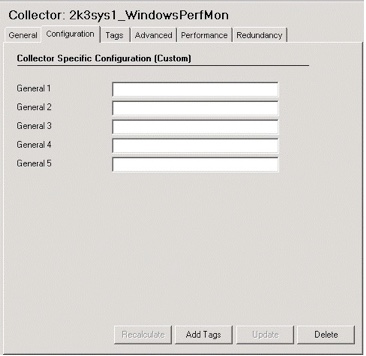
To display the Configuration tab for a Windows Performance Collector, select the Windows Performance Collector from the list of collectors and click the Configuration tab. The following figure appears.
Figure: Configuration Tab for Windows Performance Collector
