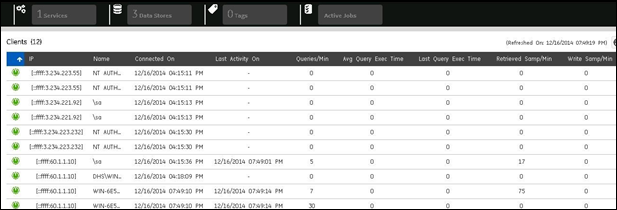
Client Panel
The Client panel in the Dashboard shows the details of all the connected clients in the system in the order of their fault levels.

| Field | Description |
|---|---|
| Connection | Indicates the status of the current connection. |
| Machine Name | The host name from where the client is connected. |
| Log-In User Name | The user name with which the client is connected. |
| Connected On | The date and time when the connection was established. |
| Last Activity | On The time when the last read and write request was made. |
| Queries/Min | The current rate at which the query requests are made. |
| Average Query Execution Time | The average time taken to execute a query. |
| Timed Out Reads | The number of timed out read requests made by clients. This counter increments when a query made by a client is taking longer time than "Max Query Time" or returning more samples than specified in the "Max Query Intervals". |
| Samples Written/Min | The current rate at which the data samples are written. |
| Details | Select this button to view more client details. To view all the clients, select the Show All Clients button. The All Clients page appears |
Client Details
This page, which is accessed from the Client Statistics panel in the dashboard, shows
the following additional detail for a client.

| Field | Description |
|---|---|
| Named Client/IP | The name of the client or IP address from where the client is connected. |
| Last Query Exec Time | The time taken to execute the last query. |
| Retrieved Samples/Min | The current rate at which the data samples are received. For more information, refer to the Client Statistics topic. |
