 Proficy Historian for Cloud
Access a Data Store
Procedure
- Access the Web Admin console.
-
Select Data Stores.
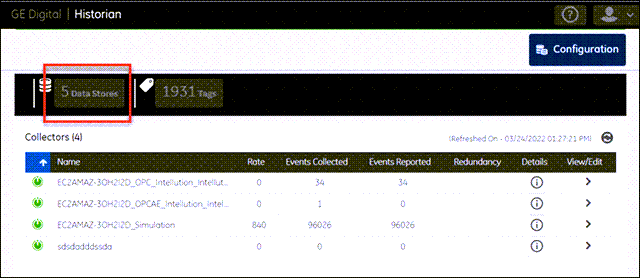 A list of data stores appears. By default, the list is refreshed every 10 minutes. You can, however, refresh it manually by selecting
 .
. -
In the row containing the data store that you want to access, select
 .
The details of the data store appear, displaying the following information:
.
The details of the data store appear, displaying the following information:Field Description Archive Compression Displays the current effect of archive data compression. If the value is zero, it indicates that archive compression is either ineffective or turned off. To increase the effect of data compression, increase the value of archive compression deadbands on individual tags. In calculating the effect of archive compression, Historian counts internal system tags as well as data source tags. Therefore, when working with a very small number of tags and with compression disabled on data source tags, this field may indicate a value other than zero. If you use a realistic number of tags, however, system tags will constitute a very small percentage of total tags and will therefore not cause a significant error in calculating the effect of archive compression on the total system.
Free Space Not applicable Consumption Rate Displays how fast the archive disk space is consumed. If the value is too high, you can reduce it by slowing the poll rate on selected tags or data points or by increasing the filtering on the data (widening the compression deadband to increase compression). Write Cache Hits Displays the hit ratio of the write cache in percentage of total writes. It is a measure of how efficiently the system is collecting data. Typically, this value should range from 95 to 99.99%. If the data is changing rapidly over a wide range, however, the hit percentage drops significantly because current values differ from recently cached values. More regular sampling may increase the hit percentage. Out-of-order data also reduces the hit ratio. Estimated Days to fill Not applicable Failed Writes Displays the number of samples that failed to be written. Since failed writes are a measure of system malfunctions or an indication of offline archive problems, this value should be zero. If you observe a non-zero value, investigate the cause of the problem and take corrective action. Historian also generates a message if a write fails. Note that the message only appears once per tag, for a succession of failed writes associated with that tag. For example, if the number displayed in this field is 20, but they all pertain to one Historian tag, you will only receive one message until that Historian tag is functional again.
Alerts Since Startup Not applicable Receive Rate Displays how busy the server is at a given instance and the rate at which the server is receiving data from collectors. Messages Since Startup Not applicable Number of Archives The number of archives in the data store. Number of Tags The number of tags in the data store.