System Reliability
About Site Filtering in System Reliability Analysis
In System Reliability Analysis, the site is assigned based on the user's selection in the Site control, and all data added or imported to the System Reliability Analysis must match the analysis's site assignment.
In System Reliability Analysis, Rules, users will see only data that is assigned to their site(s) or that is global data.
Consider an organization that has three sites, Site X, Site Y, and Site Z. The following System Reliability Analysis records exist:
- System Reliability Analysis A: Assigned to Site X
- System Reliability Analysis B: Assigned to Site Y
- System Reliability Analysis C: Assigned to Site Z
- System Reliability Analysis D: No site assigned (global record)
Scenario 1: User assigned to only Site X
This user will see System Reliability Analyses A and D.
Scenario 2: User assigned to both Site X and Site Y
This user will see System Reliability Analyses A, B, and D.
Scenario 3: Super User
This user will see System Reliability Analyses A, B, C, and D.
System Reliability Data Model
The following diagram shows how the families used in System Reliability Analysis are related to one another.
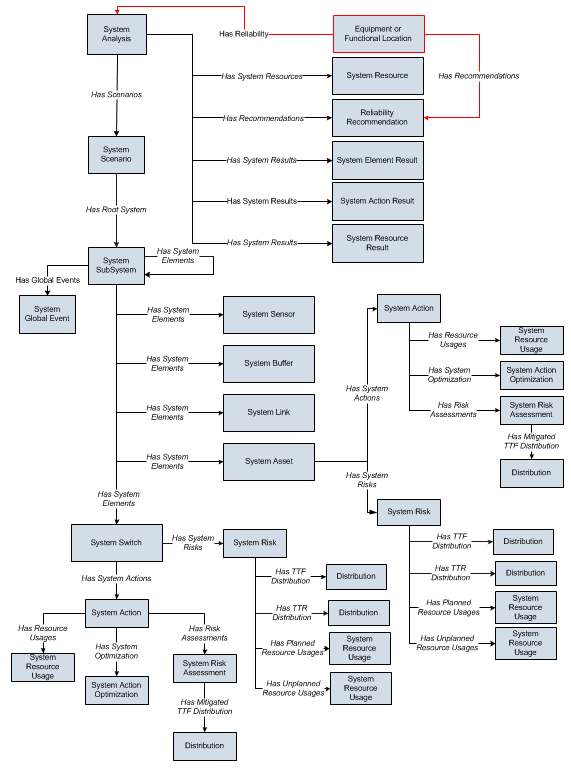
In the above image:
- Black arrows and boxes represent entity families, relationship families, and associated relationship definitions that are configured in the baseline database and do not require customization for the baseline functionality to work.
- Red arrows and boxes represent entity families, relationship families, and associated relationship definitions that may require customization.
- The System Action box represents one of four System Action subfamilies in which records can exist: System Condition Monitor, System Inspection, System Preventive Maintenance, or System Special Action. The specific family that is used will depend upon the type of Action that is created for a given Asset or Switch element.
- The Distribution box represents one of four Distribution subfamilies in which records can exist: Normal, Weibull, Exponential, Lognormal, Triangular, Gumbel, or Generalized Extreme Value record. The specific family that is used will depend upon the distribution type selected for the associated Risk.
Throughout this documentation, we use the term System Reliability Analysis to mean the combination of the root System Analysis record and all records that are linked to it.
About Results of a System Reliability Analysis
When you run a Monte Carlo simulation, the GE Digital APM system analyzes statistics about cost, performance, and reliability from the iterations of the analysis to calculate the simulation results. The simulation results display average values as well as the specific values that were used to calculate the averages.
What Can You Learn from a System Reliability Analysis?
By reviewing the results of a System Reliability Analysis, you will be able to answer questions such as:
- Which Scenario has the lowest overall cost associated with it?
- Which Scenario is the least reliable?
- Which Scenario has the highest failure rate?
- Which Actions were successful in mitigating risk and reducing cost?
- How many times were Resources used?
- How much did the Resources cost?
- For how long were the Resources used?
- How many times was an Action required?
After reviewing the results of a System Reliability Analysis, you can identify which Scenario consistently provides the best reliability and produces the least amount of downtime and cost. Based upon the results, you might decide to complete any of the following steps:
- Refine the Scenarios by modifying the analysis parameters or components within the analysis or create new components to further analyze reliability and costs.
- Create Recommendations to implement changes to the current physical system to align it with the most desirable Scenario.
Understanding the Analysis Results
The Summary tab on the System Reliability page provides an overview of the costs and Resource statistics for the simulation using graphs on the following tabs:
- Total Cost
- Total Cost Trend
- Annual Action Cost
- Action Cost Trend
- Resource Occurrence
- Resource Time
- Resource Cost
The simulation results are also presented in more detail in the following sections, which are used to organize the data in the Simulation Results workspace:
By selecting a cell in the grid in the above sections, you can view more detailed information in the following graphs:
About Total Cost Graph
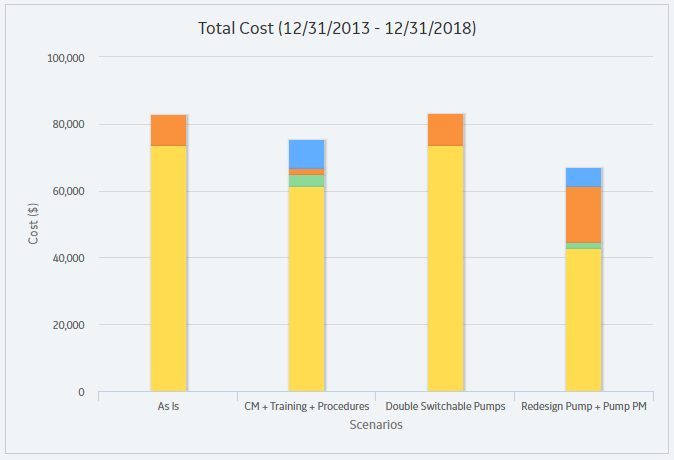
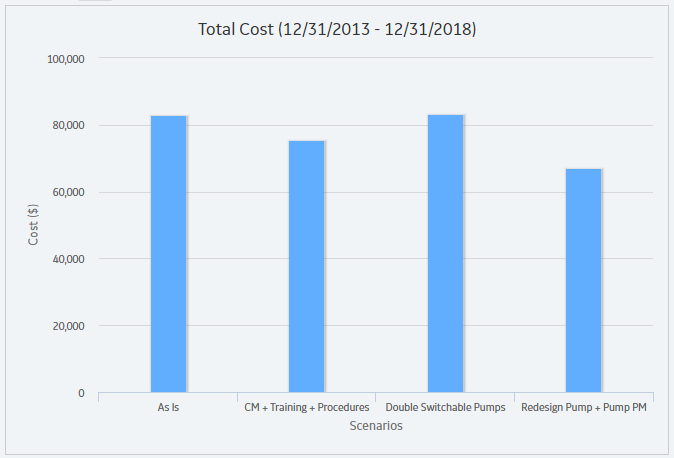
The Total Cost graph displays the average total cost for each Scenario. The total cost represents the sum of costs in the following categories:
- Lost Production Cost
- Action Cost
- Planned Correction Cost
- Unplanned Correction Cost
Details
The following image displays an example of the Total Cost graph.

The categories in the Total Cost graph are calculated for each Scenario as described here:
- Action Cost: The average Action cost across all the iterations. Action cost includes any materials or personnel needed to complete any Actions that exist in the Scenario and any Resources used to complete the Actions. The following fields are used to calculate Action costs:
- System Action record: Action Cost.
- System Resource record: Fixed Cost, Variable Cost, and Variable Cost Units.
- System Resource Usage record: Duration, Duration Units, and Quantity.
- Lost Production Cost: The average lost production cost across all iterations. Lost production cost includes the cost of lost production for any element when it is stopped or unable to run, according to the value in the Lost Product Cost field of the record that represents that element.
- Planned Correction Cost: The average planned correction cost across all the iterations. Planned correction cost includes the cost to repair an element that is identified as having a potential failure by an inspection or condition monitoring Action and any Resources used. The following fields are used to calculate planned correction costs:
- System Subsystem record: Variable Cost, and Variable Cost Units.
- System Asset record: Variable Cost and Variable Cost Units.
- System Switch record: Variable Cost and Variable Cost Units.
- System Risk record: Planned Correction Cost, Planned Correction Duration, and Planned Correction Duration Units.
- System Resource record: Fixed Cost, Variable Cost, and Variable Cost Units.
- System Resource Usage record: Duration, Duration Units, and Quantity.
-
Unplanned Correction Cost: The average unplanned correction cost across all the iterations. Unplanned correction cost includes the cost to repair any failed element and any Resources used to do so. The following fields are used to calculate unplanned correction costs:
- System Asset record: Fixed Cost, Variable Cost, and Variable Cost Units.
- System Switch record: Fixed Cost, Variable Cost, and Variable Cost Units.
- System Risk record: Fixed Unplanned Correction Cost, Variable Unplanned Correction Cost, and Variable Unplanned Correction Cost Units.
- System Resource record: Fixed Cost, Variable Cost, and Variable Cost Units.
- System Resource Usage record: Duration, Duration Units, and Quantity.
About Total Cost Trend Graph
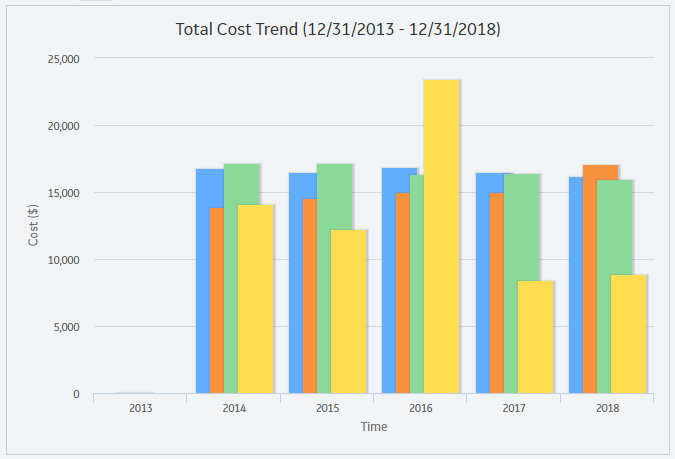
The Total Cost Trend graph displays the average total cost for each Scenario for each analysis time interval in the simulation period.
The following image displays an example of the Total Cost Trend graph.
About Annual Action Cost Plot
The Annual Action Cost graph displays the average cost of actions per year for each Scenario.
The following image displays an example of the Annual Action Cost graph.
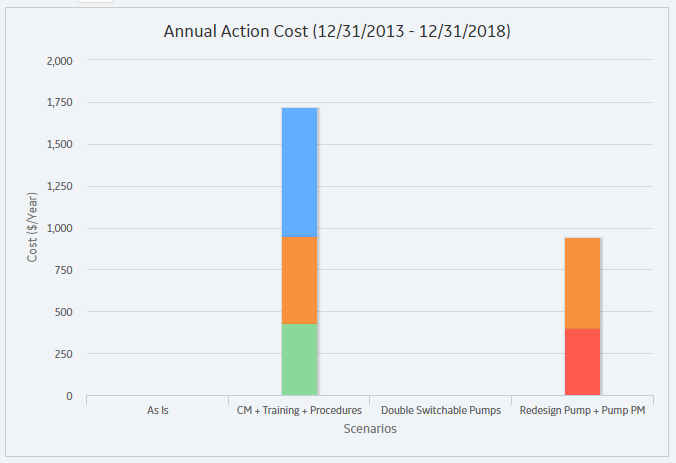
You can also compare the cost of different types of actions on this graph.
About Action Cost Trend Graph
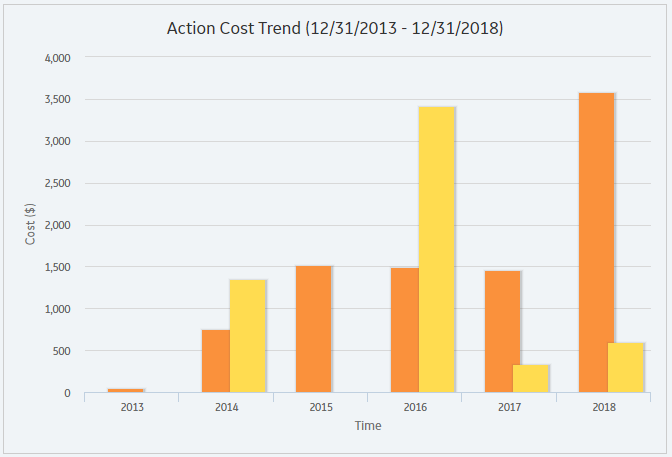
The Action Cost Trend graph displays the average total cost for actions in each Scenario for the analysis time interval in the simulation period.
The following image displays an example of the Action Cost Trend graph.
About Resource Occurrence Graph
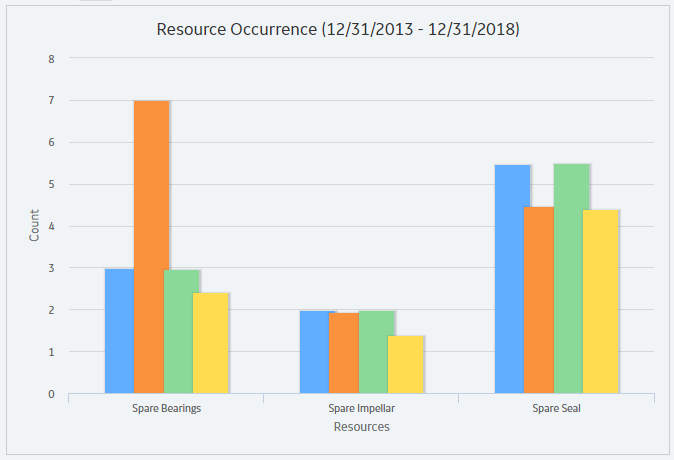
The Resource Occurrence graph displays statistics about the total use of each Resource when the value in the Count Occurrence field of the associated System Resource record is set to True. The Resource occurrence count is calculated from the average total usage across all iterations.
The following image displays an example of the Resource Occurrence plot:
About Resource Time Graph
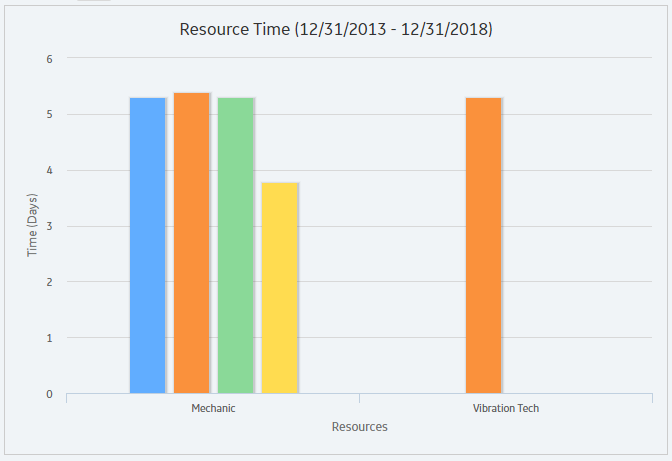
The Resource Time graph displays the total amount of time that each Resource is used per Scenario. The total amount of time is calculated as the average total amount of time that the Resource is used for all the iterations.
The following image displays an example of the Resource Time graph:
About Resource Cost Graph
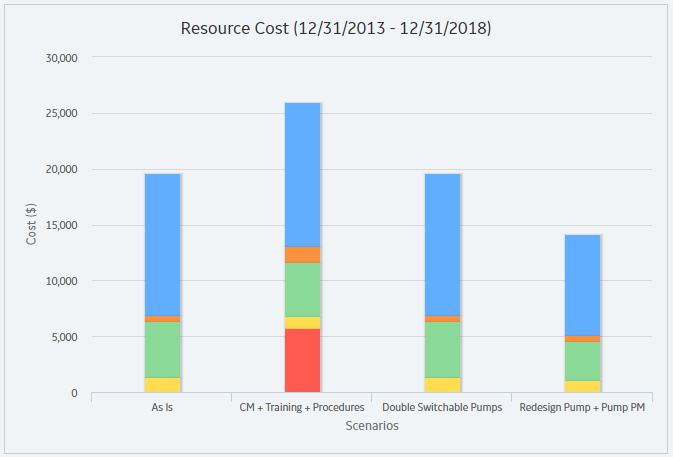
The Resource Cost graph displays the total cost of all Resources used in the Scenario. The total cost is calculated for each Scenario as the average total Resource costs for all the iterations.
The following image displays an example of the Resource Cost graph:
About Elements Section
The Elements section contains a grid that displays specific results for the elements that exist in a System Reliability Analysis.
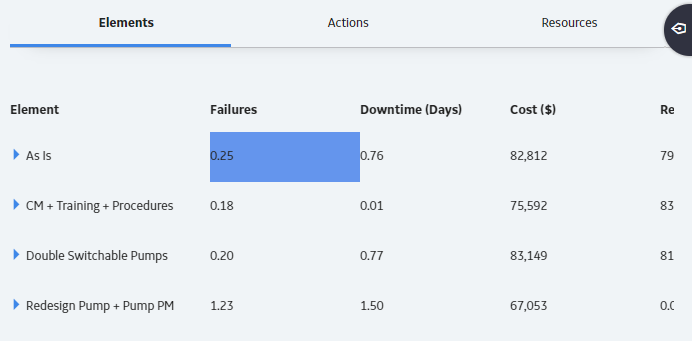
The grid contain the following columns of information:
- Element: Contains a hierarchy that lists the components in the System Reliability Analysis.
- Failures: Contains a value that indicates the average number of times the selected item failed during the analysis period for all iterations of the Scenario to which it belongs.
- Downtime (Days ): Contains a value that indicates the average number of days that the selected item was out of service due to failures or shutdowns for all iterations of the Scenario to which it belongs.
- Cost (Currency): Contains a value that indicates the average total cost of the selected item for all iterations of the Scenario to which it belongs. This includes the cost of any items that belong to the item, lost production costs, fixed costs, variable costs, Action costs, planned or unplanned correction costs, and Resource costs.
-
Reliability: Contains a value that indicates the percentage of iterations that the selected item never failed across the total number of iterations in the Scenario to which it belongs.
Note: Reliability is calculated from actual data collected from the iterations and does not represent an average value. - Availability: Contains a value that indicates the average percentage of the time that the selected item was available and running for the Scenario to which it belongs.
- Next Failure (Days): Contains a value that indicates the average amount of time, in days, from the analysis Start Date until the next failure occurs for the selected item.
- Action Cost (currency): Contains a value that specifies the average Action cost across all the iterations. Action cost includes any materials or personnel needed to complete any Actions that exist in the Scenario and any Resources used to complete the Actions.
- Lost Production Cost (currency): Contains a value that indicates the average lost production cost across all iterations. Lost production cost includes the cost of lost production for any element when it is stopped or unable to run, according to the value in the Lost Product Cost field of the record that represents that element.
- Planned Correction Cost (currency): Contains a value that indicates the average planned correction cost across all the iterations. Planned correction cost includes the cost to repair an element that is identified as having a potential failure by an inspection or condition monitoring Action and any Resources used.
- Unplanned Correction Cost (currency): Contains a value that indicates the average unplanned correction cost across all the iterations. Unplanned correction cost includes the cost to repair any failed element and any Resources used to do so.
By selecting a cell in the grid, you can view detailed information in the following graphs:
About Actions Section
The Actions section contains a grid that displays specific results for the Actions that exist in a System Reliability Analysis.
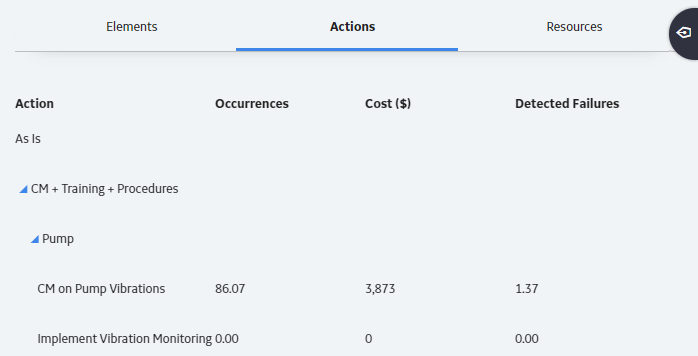
The grid contain the following columns of information:
- Action : Contains a hierarchy that lists the Actions that exist in a System Reliability Analysis. The Actions appear below the element in the Diagram to which they belong.
- Occurrences : Contains a value that indicates the average number of occurrences of the Action from all iterations of the Scenario to which it belongs.
- Cost (currency): Contains a value that indicates the average cost of the Action, including any Resources used by the Action, for the Scenario to which it belongs.
- Detected Failures: Contains a value that indicates the average number of potential failures detected in advance by the Action. This result is calculated only for Inspection Actions and Condition Monitoring Actions, which are the only Actions that can detect potential failures.
By selecting a cell in the grid, you can view detailed information in the following graphs:
About Resources Section
The Resources section contains a grid that displays specific results for the Resources that exist in a System Reliability Analysis.
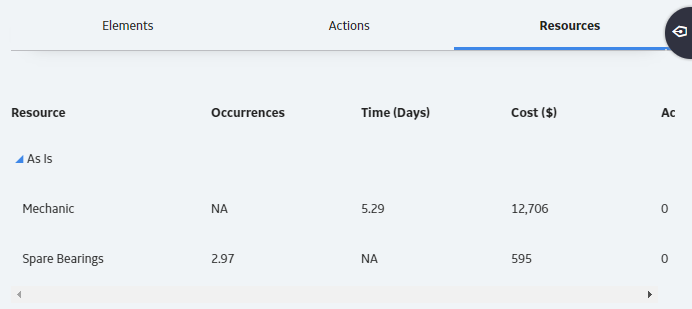
The grid contain the following columns of information:
- Resource : Displays a hierarchy that lists the Resources that exist in the System Reliability Analysis. The Resources appear below the Scenario in the hierarchy to which they belong.
-
Occurrences: Contains a value that indicates the average number of times the Resource is used during the simulation period.
Note: For System Resource records in which the Count Occurrences field is set to False, the value in this column will be 0 (zero). - Time (Days): Contains a value that indicates the average amount of time, in days, accumulated by the Resource.
- Cost (currency): Contains a value that indicates the average cost accrued by the selected Resource.
- Action Resource Cost: Contains a value that indicates the total cost of Resource needed for Actions.
- Planned Correction Resource Cost (currency): Contains a value that indicates the total cost of all planned Resources needed for Actions.
- Unplanned Correction Cost (currency): Contains a value that indicates the total cost of all unplanned Resources needed for Actions.
By selecting a cell in the grid, you can view detailed information in the following graphs:
About Histogram Plot
The Histogram Plot provides a visual representation of the frequency distribution of the result that you selected in the grid in the Elements section.
Details
The Histogram Plot shows the distribution of the actual values from all iterations that were used to calculate the average value. The distribution of the actual values spreads across a series of data ranges, which are called bins and are represented by columns on the Histogram Plot. When an actual value from an iteration falls into a bin, it is included in the associated column. The higher the column is, the more values have fallen into the bin.
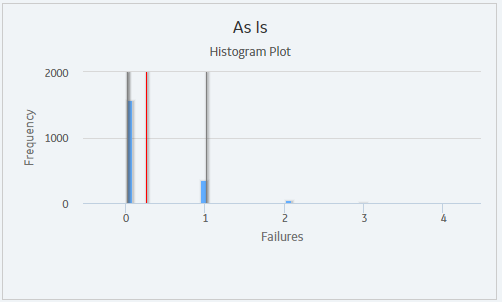
Additional values are represented by the following lines in the Histogram Plot:
- Optimistic Value: Leftmost gray vertical line in the Histogram Plot. This line represents the lower level of the confidence interval.
- Average Value: Red line in the Histogram Plot. This line represents the mean value, which is the mean value of the values from the iterations of the Scenario.
-
Realistic Value: Blue line in the Histogram Plot. This line represents the median value, which is the median value of the values from the iterations of the Scenario.
Note: If the median value falls in between two values, then the larger value will be used as the Realistic value. - Pessimistic Value: Rightmost gray vertical line in the Histogram Plot. This line represents the upper level of the confidence interval.
About Trend Plot
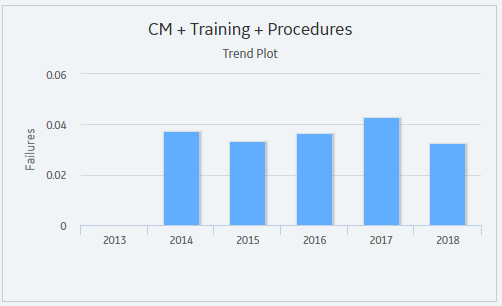
The Trend Plot provides the average value for each analysis time interval, as defined by the value in the Time Analysis Type field in the root System Analysis record, of the result that you selected in the grid.
If the Time Analysis Type field is set to:
- Yearly, the Cost Trend Plot will display the Cost Trend for each year in the simulation period.
- Monthly, the Cost Trend Plot will display the Cost Trend for each month in the simulation period.
About Impact Plot
The Impact Plot provides visual representation of the average values that are combined to make up the average value of the result that you selected in the grid.
The Impact Plot displays how the average failure value is calculated as a total of the individual Risk failure averages.
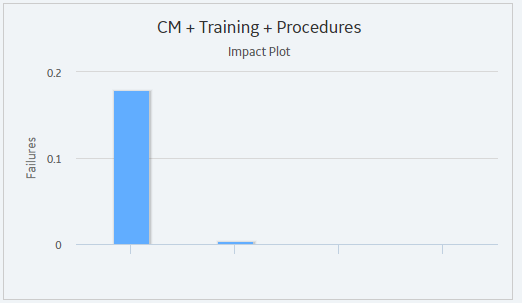
The Impact Plot is not available for the Actions and Resources tab.
- Interaction with graphs is not available on touch-screen devices.
About Interpreting Simulation Results That Include Source and Additional Risks
The results for a simulation will appear differently depending on whether or not the simulation includes source and additional Risks. It is important that you understand how to interpret simulation results that include source and additional Risks. This documentation assumes that you are familiar with System Risk records and their role in a System Reliability Analysis.
When you set up a simulation to include source and additional Risks, you should consider the following information:
- If an unplanned correction causes a source Risk and any additional Risks to be reset, in the simulation results, the Failure associated with the unplanned correction of the source Risk will be attributed only to the source Risk.
- If a planned correction of a source Risk results in additional Risks being reset, in the simulation results, the following values will be attributed to each individual Risk:
- Planned Correction Cost
- Planned Resource Usages
- Downtime
Downtime for each Risk will be calculated based on the planned correction duration for that Risk.
- If an unplanned correction of a source Risk results in additional Risks being reset, in the simulation results, the following values will be attributed to each individual Risk:
- Fixed Unplanned Correction Cost
- Variable Unplanned Correction Cost
- Unplanned Resource Usagess
- Downtime
Variable unplanned correction cost and downtime for each Risk will be calculated based on the TTR distribution for that Risk.
- If planned or unplanned correction of a source Risk results in additional Risks being reset, in the simulation results, the Equipment or Functional Location record to which the System Risk records are linked will be populated with the largest downtime value of all the Risks (i.e. source and additional). For example, suppose that the following Risks are defined for a Water Pump:
- A Bearing failure Risk that is a source Risk and whose downtime value is 1 day.
- A Seal failure Risk that is an additional Risk and whose downtime value is 2 days.
In this case, when the Bearing failure Risk resets the Seal failure Risk, in the simulation results, a downtime value of 2 days will be attributed to the Water Pump.
- If planned or unplanned correction has started for an additional Risk, and then, planned or unplanned correction starts for the source Risk that resets that additional Risk, the additional Risk will be reset only once, as a result of its own planned or unplanned correction. The additional Risk will not be reset two times as a result of its own planned or unplanned correction and the planned or unplanned correction of the source Risk. This will be reflected in the simulation results.
About Average Total
The average total is the average of all the totals across all iterations of a simulation, which is calculated by the GE Digital APM system for each simulation. Average totals are calculated for various types of numeric values in a simulation, such as cost in the Total Cost Trend plot or time in the Resource Time plot.

About Simulation Period
Some results of a System Reliability Analysis are presented according to the simulation period that you have selected. The simulation period is defined by the values in the System Analysis record:
- The values in the two Period boxes. The Period boxes represent the Period and Period Units fields in the System Analysis record and determine the length of the simulation.
- The value in the Time Analysis Type box. The Time Analysis Type box represents the Time Analysis Type field in the System Analysis record, and the value determines whether results are calculated for each year or each month of the simulation. If the Time Analysis Type is set to:
- Yearly, the graphs display values for each year included in the simulation period, which is defined by the values in the Period, Period Units, and Analysis Start Date fields in the System Analysis record.
- Monthly, the graphs display values for each month included in the simulation period, which is determined by the values in the Period, Period Units, and Analysis Start Date fields in the System Analysis record.
About Show Total Check Box
The Show Total check box is a feature that is available on the following System Reliability Analysis results plots:
In these graphs, each column represents a separate Scenario. The Show Total check box determines how the columns are displayed, as described in the following list:
- When the Show Total check box is cleared, the plots display one column that is divided into sections representing the individual cost types or resources within that Scenario. In addition, the legend displays labels for the individual categories that are represented in each column.
- When the Show Total check box is selected, the plots display one column that is not divided into sections but instead displays the total cost associated with all categories in that Scenario. In addition, the legend displays the label Total.
The following image shows the Total Cost plot for our System Reliability Analysis Example when the Show Total check box is selected.
The following image, on the other hand, shows the Total Cost plot for our System Reliability Analysis Example when the Show Total check box is cleared.
