Overview
APM System Monitoring
APM System Monitoring allows you to monitor processes and log information to better evaluate APM system performance.
Access the APM System Monitoring Page
Procedure
In the module navigation menu, select
.
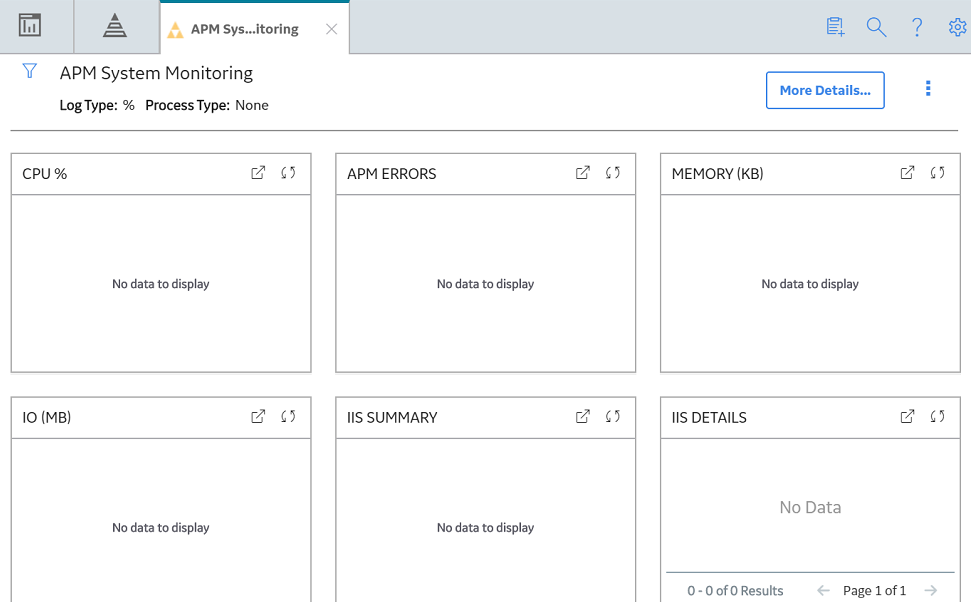
The APM System Monitoring page appears.

The APM System Monitoring page displays the following sections:
- APM Errors: Displays the number of errors associated with APM services and processes.
- CPU%: Displays a record of CPU use percentage. If two processors are being monitored, then the graph will a display use percentage based on a 200 percent limit; if three are being monitored, the use percentage will be based on a 300 percent limit; and so on.
- Memory (KB): Displays a record of memory use percentage.
- IO (MB): Displays a record of input/output transfer, in megabytes.
- IIS Summary: Displays the total number of 500 Internal Server Errors and IIS resets.
- IIS Details: Displays details related to the 500 Internal Server Errors and IIS resets.
- Log Details: Displays details related to the errors associated with APM services and processes.
Note:
You can access additional APM System Monitoring information by selecting More Details on the upper-right corner of the APM System Monitoring page. If you do, a new page will appear, displaying the following sections:
- Database Details: Displays details related to the size of monitored databases.
- Server Config: Displays details related to the specifications of each monitored server.
- Process Config: Displays details related to the APM services and processes.
- Ports: Displays details related to connected ports, including whether each is open or closed.
Tip:
In the upper-right corner of any section, you can select to refresh the information displayed.
In the upper-right corner of any section, you can select to view the information on a separate page. Refer to the Graphs and Queries documentation for information on using these interfaces.