In a Root Cause Analysis, analyzing data involves compiling the information that has been collected so far in the Root Cause Analysis and representing it visually to facilitate discussion. A Logic Tree is an organizational tool that you can use to diagram all the possible causes of a failure event.
The Logic Tree lets you represent visually the events that are associated with a failure and the cause-and-effect relationships that may have led to a failure event. The structure of the Logic Tree is hierarchical so that you can easily reference which event caused what effect. Each cause or effect is represented by a labeled icon, called a node. You can add nodes to the Failure Event node that represent components of the Root Cause Analysis. For example, if you define the Failure Event node as a fire, in the Logic Tree, you would add to the Failure Event node downstream nodes that represent all the possible causes for the failure event.
The following list provides the types of nodes that you can use in a Logic Tree Diagram:
Icon | Node |
---|---|
![]() |
Failure Event |
![]() |
Failure Mode |
![]() |
Hypothesis |
![]() ![]() |
Logic Gate |
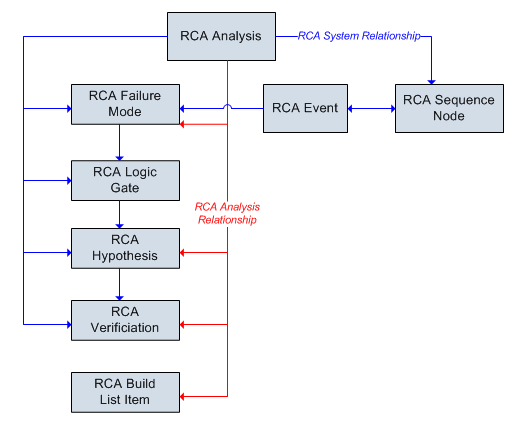
Each node has an associated, which participates in a predecessor-successor relationship. For example, each Failure Mode node that appears in the Logic Tree has an associated RCA Failure Mode that is linked to the root RCA Event. Additionally, for each Hypothesis node that appears in the Logic Tree, an associated RCA Hypothesis exists that is linked to the predecessor RCA Failure Mode and the root RCA Event. Additionally, when you add a node to the Logic Tree, a link is created between that node and the RCA.
The following image illustrates the basic structure of the Logic Tree. For more information on each level of the Logic Tree, select the link that contains the name on the associated node in the image.
The Event Diagram can depict the cause-and-effect of events that led to the failure event and post-failure activities. The Logic Tree, however, can depict, starting with the failure event, possible causes and hypotheses related to the event itself.
The Event Diagram enables the RCA Team to view and organize the chain of events prior to the failure event and identify possible work process issues. The following image shows an Event Diagram that was created in the Event Diagram workspace.
The Logic Tree can depict, starting with the failure event, possible causes and hypotheses related to the event itself. The Logic Tree enables the RCA Team to organize and discussion points on the possible causes of the failure event. The following image shows a Logic Tree that was created using options in the Logic Tree workspace.
An Event Diagram and a Logic Tree consist of an RCA Event and all the records that are linked to it directly or indirectly. For example, after you define the failure event, you can create RCA Failure Modes to link to the RCA Event, and then you can link RCA Hypothesis to the RCA Failure Modes, and so on.
The following image shows the entity families and relationship families that are used to create an Event Diagram and a Logic Tree in Root Cause Analysis. The Logic Tree and the Event Diagram share an RCA Event. The RCA Sequence Node family is used only by the Event Diagram. All of the other families are used by the Logic Tree.
Records in the RCA Logic Gate family can be linked to others in the RCA Logic Gate family. Additionally, records in the RCA Sequence Node family can be linked to others in the RCA Sequence Node family.
In addition to the relationships that appear in the images, the following families can be linked to records in the RCA Reference Document family through a relationship definition on the Has Reference Documents family:
Copyright © 2018 General Electric Company. All rights reserved.