This topic provides an example of a System Reliability Analysis. This example will be referred to as necessary throughout the System Reliability Analysis documentation.
This System Reliability Analysis example involves a water bottling facility, which contains a system that performs the following steps in the water bottling process:
Note: In this example, we assume that the bottles, labels, and caps are produced at a separate facility and utilized in this process.
For our example, we will use three different scenarios to evaluate the reliability and cost associated with three different models for this system:
Diagram
Scenario A represents the current structure of the system as shown in the following image.
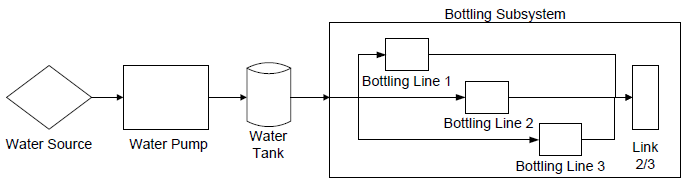
The physical model for Scenario A includes the following components:
Risks
When the Water Pump element fails due to a risk, the entire system will fail and accrue lost production costs. The following risks are assigned to the Water Pump element in Scenario A:
Every time the Water Pump experiences an unplanned Bearing Failure, the correction will require the use of the Bearing, Mechanic, and Seal Resources. If the Water Pump requires a bearing replacement as the result of a planned correction, only the Bearing and Mechanic Resources will be needed. Therefore, the following Resources have been assigned to the Bearing Failure Risk:
Actions
There are no actions defined for Scenario A.
Diagram
Scenario B represents the current structure of the system as shown in the following image.
The physical model for Scenario B is shown in this image. It is identical to Scenario A, but Actions and additional Resources have been assigned to the Water Pump in this Scenario to mitigate Risks.
Risks
The same Risks are defined for Scenario B as are defined for Scenario A. The same Resources are assigned to these Risks.
Actions
For Scenario B, the following Actions have been defined for the Water Pump:
Diagram
Scenario C represents the current structure of the system as shown in the following image.
The physical model for Scenario C is shown in this image. It is similar to Scenario A but contains the following additional components:
Risks
The same Risks are defined for Scenario C as are defined for Scenarios A and B. The same Resources are assigned to these Risks.
Actions
There are no Actions defined for Scenario C.
In addition to these scenarios, we will define the following resources for our example:
By comparing Scenario A, Scenario B, and Scenario C, we will be able to view each scenario's reliability and cost and identify the scenario that has the highest reliability and lowest cost associated with it. Scenario A represents the current design, and both Scenario B and Scenario C represent modifications to the original design. These modifications support different hypotheses about modifying our current system:
By modeling and comparing the three different Scenarios, we should be able to draw conclusions and make recommendations about changes that should be implemented to improve the reliability of the system.
This is a simple example and is limited to three scenarios only. As you develop a System Reliability Analysis, you may want to develop additional scenarios that model other variations to the system. As we continue to use this example throughout the System Reliability documentation, we will provide suggestions for where you might modify or extend our example to take advantage of the System Reliability features to create a more complex, in-depth analysis.
This example contains one root System Analysis record. The following values exist in the fields of that record:
Fields | Values |
---|---|
Name | System Reliability Analysis Example |
Currency | $ |
Start Date | 1/1/2010 12:00:00 AM |
Period | 7 Years |
Iterations | 1000 |
Time Analysis Type | Yearly |
Confidence (%) | 90 |
Histogram Bins | 20 |
Enable Event Log | False |
Random Seed | True |
The following table shows the data stored in the System Scenario records in this example:
Scenarios | Values Specified |
---|---|
Scenario A |
Name: Scenario A Description: Current Structure |
Scenario B |
Name: Scenario B Description: Current Structure With Actions |
Scenario C |
Name: Scenario C Description: Redesigned Structure With Backup Pump |
Each Scenario in this example contains two System Subsystem records. One System Subsystem record contains the Diagram structure for each Scenario, and the other System Subsystem record contains the Bottling Lines, which are used in all three Scenarios. The following table lists the data that exist in each record.
Subsystem | Values Specified |
---|---|
Diagram for Scenario A |
Name: Diagram for Scenario A Production Contribution: 100 Fixed Cost: 0 Variable Cost: 0 Variable Cost Units: Per Day Lost Production Cost: 100000 Lost Production Cost Units: Per Day |
Diagram for Scenario B |
Name: Diagram for Scenario B Production Contribution: 100 Fixed Cost: 0 Variable Cost: 0 Variable Cost Units: Per Day Lost Production Cost: 100000 Lost Production Cost Units: Per Day |
Diagram for Scenario C |
Name: Diagram for Scenario C Production Contribution: 100 Fixed Cost: 0 Variable Cost: 0 Variable Cost Units: Per Day Lost Production Cost: 100000 Lost Production Cost Units: Per Day |
Bottling Subsystem |
Name: Bottling Subsystem Production Contribution: 100 Fixed Cost: 0 Variable Cost: 0 Variable Cost Units: Per Day Lost Production Cost: 0 Lost Production Cost Units: Per Day |
The following table shows the data stored in the System Asset records in this example. The light blue row identifies the Scenario(s) in which each Asset element is used.
Asset | Values Specified |
---|---|
All Scenarios | |
Water Source |
Name: Water Source Production Contribution: 100 Fixed Cost: 0 Variable Cost: 0 Variable Cost Units: Per Day Lost Production Cost: 0 Lost Production Cost Units: Per Day |
Bottling Line |
Name: <Bottling Line 1, Bottling Line 2, or Bottling Line 3> 1All Bottling Lines use the same data with the exception of the Name field, whose value is different for each Asset element. Production Contribution: 40 Fixed Cost: 0 Variable Cost: 0 Variable Cost Units: Per Day Lost Production Cost: 0 Lost Production Cost Units: Per Day |
Scenario A | |
Water Pump |
Name: Water Pump Production Contribution: 100 Fixed Cost: 5000 Variable Cost: 50 Variable Cost Units: Per Hour Lost Production Cost: 0 Lost Production Cost Units: Per Day |
Scenario B | |
Water Pump |
Name: Water Pump Production Contribution: 100 Fixed Cost: 5000 Variable Cost: 50 Variable Cost Units: Per Hour Lost Production Cost: 0 Lost Production Cost Units: Per Day |
Scenario C | |
Water Pump 1
|
Name: Water Pump 1 Production Contribution: 100 Fixed Cost: 5000 Variable Cost: 50 Variable Cost Units: Per Hour Lost Production Cost: 0 Lost Production Cost Units: Per Day |
Water Pump 2 |
Name: Water Pump 2 Production Contribution: 100 Fixed Cost: 5000 Variable Cost: 50 Variable Cost Units: Per Hour Lost Production Cost: 0 Lost Production Cost Units: Per Day |
The following table shows the data stored in the System Buffer record for this example:
Field | Value |
---|---|
Name | Water Tank |
Production Contribution | 100 |
Initial Quantity in Percentage | 50 |
Time to Empty | 0.5 |
Time to Empty Units | Days |
Time to Refill | 5 |
Time to Refill Units | Days |
The following table shows the data stored in the System Link record for this example:
Field | Value |
---|---|
Name | Link |
Minimum Predecessors: | 2 |
The following table shows the data stored in the System Sensor records for this example:
Sensor | Values Specified |
---|---|
Sensor 1 |
Name: Sensor 1 Monitored Elements: Water Pump 1 Activated Switches : Switch 2 Deactivated Switches: Switch 1 |
Sensor 2 | Name: Sensor 2 Monitored Elements: Water Pump 2 Activated Switches: Switch 1 Deactivated Switches: Switch 2 |
The following table shows the data stored in the System Switch records in this example:
Element | Values Specified |
---|---|
Switch 1 |
Name: Switch 1 Is Initially On: Yes Production Contribution: 100 Fixed Cost: 0 Variable Cost: 0 Variable Cost Units: Per Day Lost Production Cost: 0 Lost Production Cost Units: Per Day |
Switch 2 |
Name: Switch 2 Is Initially On: No Product Contribution: 100 Fixed Cost: 0 Variable Cost: 0 Variable Cost Units: Per Day Lost Production Cost: 0 Lost Production Cost Units: Per Day |
The following table shows the data for the Risks used in this example:
Note: The Source column identifies the entity family name of the record in which the associated data is stored. The data from all source records is combined to create the comprehensive Risk data.
Risk | Assigned To | Source | Values Specified |
---|---|---|---|
Water Source Failure | Water Source Asset in all Scenarios | System Risk Record |
Name: Water Source Failure Last Failure: 1/1/1999 12:00:00 AM Fixed Unplanned Correction Cost: 0 Variable Unplanned Correction Cost: 0 Per Day Planned Correction Cost: 0 Planned Correction Duration: 0 Hours Is Active: True Is Latent: False Failure Without Replacement: False Number of Subcomponents: 1 PF Interval: 0 Days Repair Immediately: True Percentage of PF Interval to Wait(%): 0 |
Exponential |
Name: TTF Distribution Distribution Type: Exponential Time Unit: Years MTBF: 20 Enable Distribution Association: No |
||
Exponential |
Name: TTR Distribution Distribution Type: Exponential Time Unit: Weeks MTBF: 2 Enable Distribution Association: No |
||
Bottling Line Failure | Bottling Line Asset in all Scenarios | System Risk Record |
Name: Bottling Line Failure Last Failure: 1/1/1999 12:00:00 AM Fixed Unplanned Correction Cost: 0 Variable Unplanned Correction Cost: 0 Per Day Planned Correction Cost: 0 Planned Correction Duration: 0 Hours Is Active: True Is Latent: False Failure Without Replacement: False Number of Subcomponents: 1 PF Interval: 0 Days Repair Immediately: True Percentage of PF Interval to Wait (%): 0 |
Exponential |
Name: TTF Distribution Distribution Type: Exponential Time Unit: Months MTBF: 12 Enable Distribution Association: No |
||
Normal |
Name: TTR Distribution Distribution Type: Exponential Time Unit: Days MTTR: 1 Enable Distribution Association: No |
||
Seal Failure |
|
System Risk Record |
Name: Seal Failure Last Failure: 1/1/1999 12:00:00 AM Fixed Unplanned Correction Cost: 1500 Variable Unplanned Correction Cost: 1000 Per Day Planned Correction Cost: 1000 Planned Correction Duration: 4 Hours Is Active: True Is Latent: False Failure Without Replacement: No Number of Subcomponents: 1 PF Interval: 30 Days Repair Immediately: True Percentage of PF Interval to Wait (%): 0 |
Weibull |
Name: TTF Distribution Distribution Type: Weibull Time Unit: Years Beta: 4 Eta: 3 Gamma: 0 Enable Distribution Association: No |
||
Normal |
Name: TTR Distribution Distribution Type: SingleValue Time Unit: Hours Value: 12 Enable Distribution Association: No |
||
Bearing Failure |
|
System Risk Record |
Name: Bearing Failure Last Failure: 1/1/1999 12:00:00 AM Fixed Unplanned Correction Cost: 2000 Variable Unplanned Correction Cost: 1000 Per Day Planned Correction Cost: 1000 Planned Correction Duration: 4 Hours Is Active: True Is Latent: False Failure Without Replacement: False Number of Subcomponents: 1 PF Interval: 6 Weeks Repair Immediately: True Percentage of PF Interval to Wait (%): 0 |
Exponential |
Name: TTF Distribution Distribution Type: Exponential Time Unit: Months MTBF: 60 Enable Distribution Association: No |
||
Exponential |
Name: TTR Distribution Distribution Type: Exponential Time Unit: Hours MTTR: 8 Enable Distribution Association: No |
||
Impeller Failure |
|
System Risk Record |
Name: Impeller Failure Last Failure: 1/1/1999 12:00:00 A.M. Fixed Unplanned Correction Cost: 1500 Variable Unplanned Correction Cost: 1000 Per Day Planned Correction Cost: 1000 Planned Correction Duration: 4 Hours Is Active: True Is Latent: False Failure Without Replacement: False Number of Subcomponents: 1 PF Interval: 0 Days Repair Immediately: True Percentage of PF Interval to Wait (%): 0 |
Exponential |
Name: TTF Distribution Distribution Type: Exponential Time Unit: Months MTBF: 24 Enable Distribution Association: No |
||
Normal |
Name: TTR Distribution Distribution Type: Single Value Time Unit: Hours Value: 12 Enable Distribution Association: No |
The following table shows the data used in the Actions in this example. This information defines the properties of the Actions associated with the Water Pump element in Scenario B.
Note: The Source column identifies the entity family name of the record in which the associated data is stored. The data from all source records is combined to create comprehensive Action data.
Action | Mitigated Risk | Source | Values Specified |
---|---|---|---|
Redesign Impellers Impeller Failure | System Special Action Record |
Name: Redesign Impellers Action Cost: 1600 Interval: 2 Years Duration: 2 Days Shutdown Required: True One Time Action: True Replace Failure Consequence: True Replace TTF Distribution: True |
|
System Risk Assessment |
Mitigated Unplanned Correction Cost: 10001 Note: When you associate a Risk to an Action that is represented by a System Special Action record, and select the hyperlinked Action name in the Actions pane on the System Reliability Scenarios - Actions page, the Mitigated Unplanned Correction Cost field appears in the New Failure Consequence section on the Mitigated Risks tab and is labeled Fixed Unplanned Correction Cost. |
||
Weibull |
Name: New TTF Distribution Distribution Type: Weibull Time Unit: Months Beta: 4 Eta: 48 Gamma: 0 |
||
Replace Seals | Seal Failure | System Preventive Maintenance Record |
Name: Replace Seals Action Type: Time-Based Maintenance (Preventive) (PM) Action Cost: 2000 Interval: 2 Years Duration: 4 Hours Shut Down Required: True One Time Action: False |
Vibration Analysis | Bearing Failure | System Inspection Record |
Name: Vibration Analysis Action Type: Condition-Based Maintenance (Predictive) (CM) Condition Monitoring Type: Periodic Action Cost: 0 Interval: 3 Weeks Duration: 1 Hours Shut Down Required: False One Time Action: False Detection Probability(%): 90 |
The following table shows the data stored in the System Resource records in this example:
Resource | Values Specified |
---|---|
Bearing |
Name: Bearing Fixed Cost: 200 Variable Cost: 0 Per Day Count Occurrences: True |
Mechanic |
Name: Mechanic Fixed Cost: 0 Variable Cost: 100 Per Hour Count Occurrences: False |
Seal |
Name: Seal Fixed Cost: 250 Variable Cost: 0 Per Day Count Occurrences: True |
Vibration Technician |
Name: Vibration Technician Fixed Cost: 0 Variable Cost: 100 Per Hour Count Occurrences: False |
The following table shows the data stored in the System Resource Usage records in this example:
Resource | Linked To | Values Specified |
---|---|---|
Vibration Technician | Vibration Analysis Action |
Resource: Vibration Technician Quantity: 1 Duration: 1 Duration Units: Hours |
Mechanic | Bearing Failure Risk |
Planned Resource Usage Resource: Mechanic Quantity: 1 Duration: 4 Duration Units: Hours
Unplanned Resource Usage Resource: Mechanic Quantity: 1 Duration: 8 Duration Units: Hours |
Bearing | Bearing Failure Risk |
Planned Resource Usage Resource: Bearing Quantity: 2 Duration: 0 Duration Units: Hours
Unplanned Resource Usage Resource: Bearing Quantity: 2 Duration: 0 Duration Units: Hours |
Seal | Bearing Failure Risk |
Unplanned Resource Usage Resource: Seal Quantity: 1 Duration: 0 Duration Units: Hours |
Copyright © 2018 General Electric Company. All rights reserved.