A Goodness of Fit (GOF) test determines how well your analysis data fits the calculated data model.
On the Reliability Growth page, in the Segment pane, the Passed GOF check box is selected when your data passes the test and cleared when your data fails the test.
To determine whether the data passes the GOF test, the GE Digital APM system uses the following values:
GE Digital APM uses two different methods to calculate GOF for Reliability Growth Analyses, depending on whether or not the analyses use grouped data.
Goodness of Fit (GOF) for a Reliability Growth Analyses based on data that is not grouped is calculated using the Cramer-von Mises test.
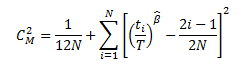
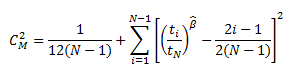
For analyses whose end date is time-based, Cramer-von Mises test uses the following formula to calculate the GOF Statistic:
For analyses whose end date is event-based, Cramer-von Mises test uses the following formula to calculate the GOF statistic:
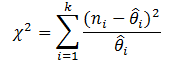
Goodness of Fit for a Reliability Growth Analysis based on grouped data is calculated using a Chi-squared test. This test uses the following formula to calculate a test statistic:
For non-grouped data, the Cramer-von Mises test is used to determine whether the data passes the GOF test. This test compares the GOF Statistic to a Critical Value. The Critical Value depends on two values:
Alpha is determined using the Confidence Level, which you can define manually for each analysis. The Confidence Level indicates the percentage of uncertainty of the Goodness of Fit method. This percentage is usually determined by experience or an industry standard and limits how closely the data must fit the model in order for it to pass the Goodness of Fit test. The higher the Confidence Level, the easier it will be for your data to pass the Goodness of Fit test. The lower the Confidence Level, the harder it will be for your data to pass the Goodness of Fit test. If the data does pass, however, the data will be a very close fit to the model.
Note: When you select a Confidence Level, you must specify 80, 90, 95, or 98 percent. If you do not modify the confidence level, alpha is automatically set to 0.1 (i.e., a confidence level of 90%).
After a Confidence Level has been determined, the GE Digital APM system uses the following Critical Values for Cramer-von Mises Test chart to find the Critical Value. The chart displays critical values at five confidence levels (80%, 85%, 90%, 95% and 98%) which in turn calculate 5 alpha values (0.2, 0.15, 0.1, 0.05, 0.02).
For grouped data, the Chi-squared test is used to determine whether the analysis passed the GOF test. This test uses Degrees of Freedom (i.e., the number of datapoints - 2) and the Confidence Level to calculate a Critical Value, which is then compared to the GOF Statistic to determine whether the analysis passed the GOF test. The Confidence Level is defined the same way it is in the Cramer-von Mises test (i.e., it indicates the percentage of uncertainty of the Goodness of Fit method).
The following formula is used to calculate the Chi-squared distribution.
In the formula, k is degrees of freedom and F(x;k) is the Confidence Level. These values are used to find the Critical Value, x.
For both the Cramer-von Mises test and the Chi-squared test, if the GOF statistic is greater than the Critical Value at the chosen Confidence Level, the data fails the GOF test. This means the data does not follow the analysis pattern closely enough to confidently predict future measurements. If the GOF Statistic is lower than the Critical Value, the population passes the test, which means data is more likely to occur in a pattern and therefore is more predictable.
For example, if you run a Reliability Growth Analysis on a set of failure data, and the data fails the GOF test, it may mean that the piece of equipment or location does not fail in a predictable pattern (i.e., the piece of equipment or location fails at random). If this is the case, any predictions you make based on this data will not be as reliable as predictions made against data that has passed the GOF test.
If the analysis fails a GOF test, it does not necessarily mean that you cannot use the data model. The Reliability Growth Analysis might fail a GOF test because there is more than one trend within the data. If you suspect this is the case, you can split the analysis into segments at the points where it looks like a change occurred. Afterwards, the separate segments may individually pass the GOF test because they have been split up into multiple failure patterns.
Additionally, if the analysis fails the GOF test, you should also check for a visual goodness of fit. Models can sometimes still be used even if the analysis does not pass the GOF test.
Copyright © 2018 General Electric Company. All rights reserved.