When management personnel request that work be performed on a piece of equipment, the work results in some amount of downtime for the piece of equipment. Some work activities result in longer amounts of downtime than others. In your company, work requests are recorded in Work Request records, which contain the following fields:
- Work Request ID Identifies the work request with a unique value.
- Work Activity Indicates the type of work that should be performed (e.g., repair).
- Downtime Indicates the total amount of time that the equipment was out of service while work was being performed on it.
If you were to create a Select query to view information about work requests that have been completed, the results might look something like those shown in the following image.
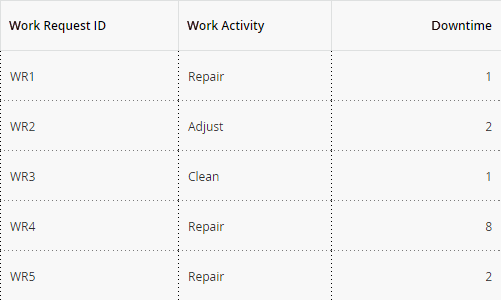
In these results, you can see each work request ID, the corresponding work activity, and the total amount of downtime per request. The format of these results, however, does not display the work requests grouped by activity type. While this result set is small, which allows you to visually determine how many work requests fall into each activity type, more typical query results will contain enough rows of data that it will be difficult to divide it into categories by visually comparing the data. This is especially true when the results span multiple pages.
To group the results such that you can see at a glance how many work requests fall into each activity type, you could decide to make the query an aggregate query. If you use the COUNT function on the Work Request ID field and the SUM function on the Downtime field, the query results would look similar to those shown in the following image.
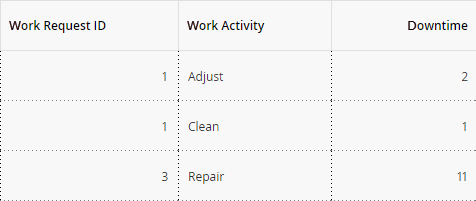
In these results, you can see that three work requests asked for an adjustment, three requests asked for something to be cleaned, and four work requests asked for a repair. You can also see that the total amount of downtime for all adjustments was four days, the total amount of downtime for all cleaning tasks was six days, and the total amount of downtime for all repairs was 20 hours.
While the stored data is interesting when viewed in this format, you might be more interested in determining which work requests resulted in a downtime over a certain number of days. For instance, suppose that you expect repairs to take over seven days, but cleaning tasks that take more than seven days are unacceptable to management personnel. You might want to construct the query such that it groups the raw data into two categories: downtime and work activity. You then want to determine how many work requests in each type of activity resulted in downtime between one and seven days, and how many resulted in downtime over seven days.
The results of a Select query cannot present the data in this format. To format the data such that it provides the desired information, you must create a Crosstab query, where you can:
- Convert the stored downtime values into categories: 1 to 7 Days and Over 7 Days.
- Determine the total amount of downtime per work activity.
- Divide the total amount of downtime per work activity into the predefined categories of 1 to 7 Days and Over 7 Days.
The Crosstab query will contain the same fields as the Select query: Work Request ID, Work Activity, and Downtime.
To convert the stored downtime values into categories, however, you will need to add another column that includes a DECODE statement that uses the SIGN function.
The DECODE statement would look like this:
Decode(SIGN(([Work Request].[Downtime] - 7)), -1, '1-7 Days', 0, '1-7 Days', 'Over 7 Days')
This statement indicates that:
- First, the value seven should be subtracted from the actual downtime values. Because the Downtime field has a unit of measure of Days, and there are seven days in a week, each downtime value will be greater than or equal to zero and less than or equal to seven. After subtracting the value seven from these stored downtime values, the calculated result will be either a negative number, zero, or a positive number.
- After subtracting seven from the actual downtime value:
- If the value is negative or zero, the record should be grouped into the category 1 to 7 Days. This means that any work request with the following downtime values will be grouped into the 1 to 7 Days category: 0, 1, 2, 3, 4, 5, 6.
- If the value is anything other than zero or a negative number, the record should be grouped into the category Over 7 Days. This means that any work request with a downtime value greater than or equal to eight will be grouped into the category Over 7 Days.
In the grid in the Conditions section, the Work Activity field will be the row heading, and the column with the DECODE statement will be the column heading. The Work Request ID field will be the intersecting field, or the Value, and a COUNT function will be defined in the Total cell for the Work Request ID field. This means that the intersecting cell in the results will contain a number instead of a Work Request ID. The number will indicate the number of work requests that fall into the category defined by the intersection of the row and the column (e.g., the number of repair work requests that resulted in a downtime of over seven days).
In addition, the SUM function will be defined in the Total cell for the Downtime field. This will ensure that the results contain only one row representing each work activity instead of multiple rows containing the same work activity. For example, if there are three repair requests, because the SUM function is defined on the Downtime field, the results will contain only one row representing the repair work type (displaying the total number of work requests of that type) instead of three rows representing the repair work type (displaying only one work request of that type for each row).
The results will be grouped as shown in the following table.
| Work Activity |
Downtime Category (1 to 7 Days) |
Downtime Category (Over 7 Days) |
| Work Activity (Repair) |
# of Repairs with a Downtime of 1 to 7 Days |
# of Repairs with a Downtime Over 7 Days |
| Work Activity (Clean) |
# of Cleaning Tasks with a Downtime of 1 to 7 Days |
# of Cleaning Tasks with a Downtime Over 7 Days |
| Work Activity (Adjust) |
# of Adjustments with a Downtime of 1 to 7 Days |
# of Adjustments with a Downtime Over 7 Days |