If you have decided to display custom values in the Risk Matrix, you can create a template that will determine how values will be displayed in individual cells and on the tab labels.
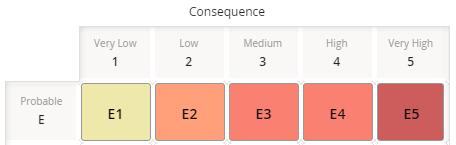
For example, suppose your custom aliases appear in the Risk Matrix like this:
You can see that the risk value in each cell is a combination of the row alias and column alias, without a delimiter. You can also see that the selected risk value is reflected on the tab label. For instance, at the intersection of the Probable E row and the Very Low 1 column, you see the value E1, which is also displayed on the tab label.
You could change this so that the risk values use a delimiter, such as a dash, so you would see E-1 instead of E1.
Steps
In the Alias Format Mask box, enter a formula that represents the format in which you want risk values to be displayed, using any combination of the following parameters, with or without delimiters:
For example, suppose you want risk values to be displayed using the format <row alias> - <column alias>. In other words, if the row alias is E and the column alias is 1, you want the risk value will be displayed as E-1. In this case, you would type the following formula in the Alias Format Mask box: {r}-{c}
Select
The template has been defined.
Copyright © 2018 General Electric Company. All rights reserved.