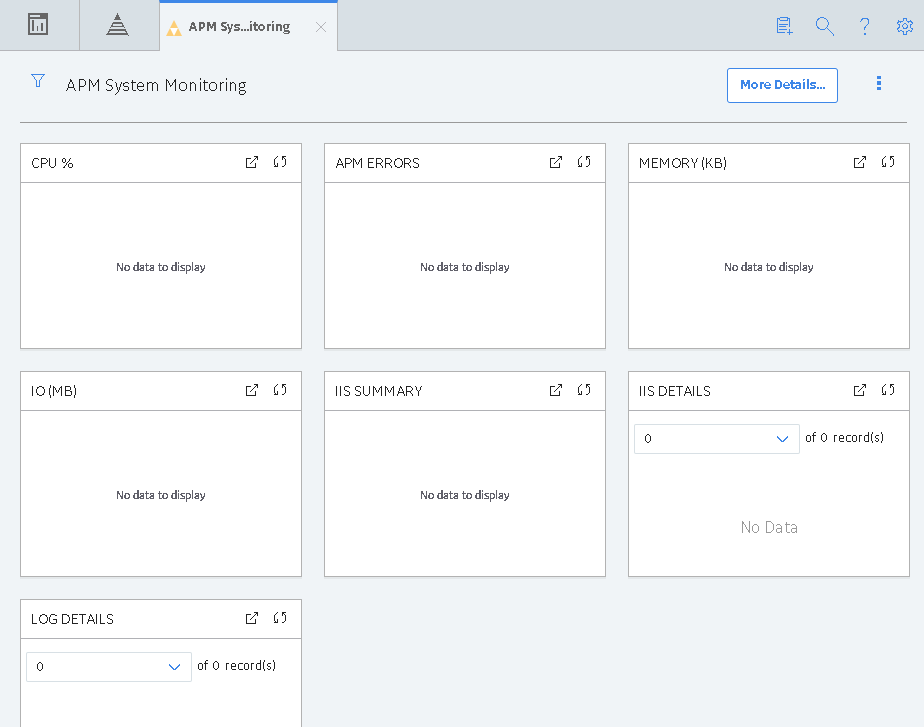
Select APM System Monitoring.
The APM System Monitoring page appears.

The APM System Monitoring page displays the following sections:
- APM Errors: Displays the number of errors associated with GE Digital APM services and processes.
- CPU%: Displays a record of CPU use percentage. If two processors are being monitored, then the graph will a display use percentage based on a 200 percent limit; if three are being monitored, the use percentage will be based on a 300 percent limit; and so on.
- Memory (KB): Displays a record of memory use percentage.
- IO (MB): Displays a record of input/output transfer, in megabytes.
- IIS Summary: Displays the total number of 500 Internal Server Errors and IIS resets.
- IIS Details: Displays details related to the 500 Internal Server Errors and IIS resets.
- Log Details: Displays details related to the errors associated with GE Digital APM services and processes.
Note: You can access additional APM System Monitoring information by selecting More Details on the upper-right corner of the APM System Monitoring page. If you do, a new page will appear, displaying the following sections:
- Database Details: Displays details related to the size of monitored databases.
- Server Config: Displays details related to the specifications of each monitored server.
- Process Config: Displays details related to the GE Digital APM services and processes.
- Ports: Displays details related to connected ports, including whether each is open or closed.