In the element section to which you want to add cost data, in the cell, select
The window appears.
IMPORTANT: To execute this procedure, membership in Security Groups additional to those normally associated with this module is required. For more information, please see the Security Groups topic for this module in the Deploying Modules and Features section of the Installation documentation.
Steps
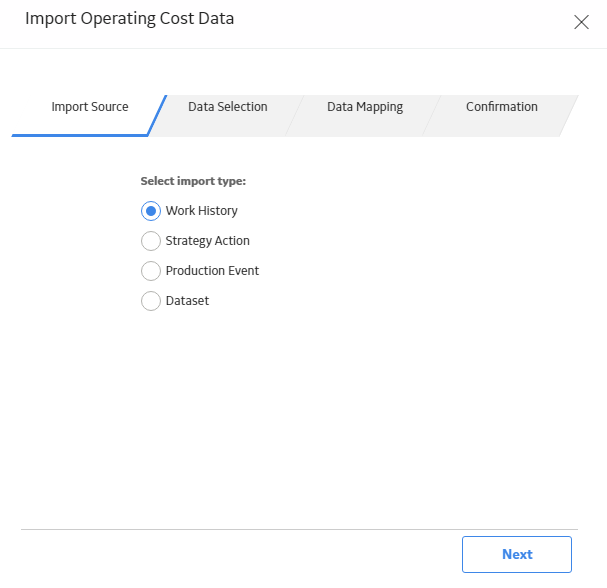
In the element section to which you want to add cost data, in the Operating Cost cell, select
The Import Operating Cost Data window appears.
Select Next.
Based on the assets associated with the element, a list of work history events and their associated event types and costs appears.

Select the work history events that you want to import, and then select Next.
The Data Mapping section appears.

In the Start Date and End Date boxes, select dates to set the Review Period for the events you are importing, then select Next.
A list of the costs that you are importing appears.

Depending on how you want the data to be displayed in the grid, select Individual Costs or Group costs and sum total.
Note: If Individual Costs is selected, then each selected event will add a new row to the Cost Data grid. If Group costs and sum total is selected, then all selected action costs are summed by year number and inserted into grid as one row.
Select Finish.
The selected cost data is imported to the Cost Data grid and repeated every review period until the end of the analysis with cost inflation applied.
Select Next.
A list of Strategy Actions related to the asset or asset group selected in the primary or secondary element appears.
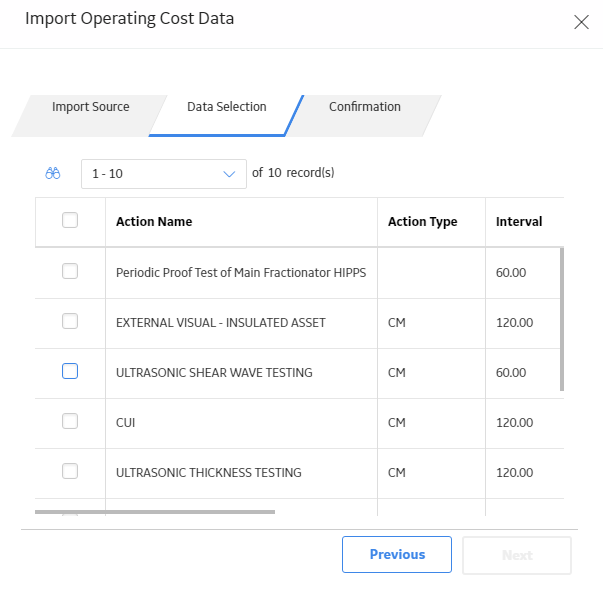
Beside each Strategy Action that you want to import, select the check box, and then select Next.
The Confirmation screen appears displaying the list of Strategy Actions that you selected and their associated costs.
Note: The Strategy Actions associated with the asset will only appear in the list if the strategy is currently active.
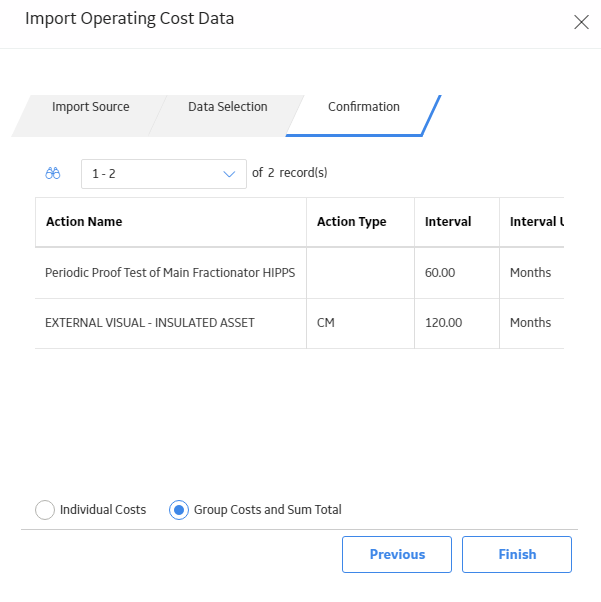
Select Individual Costs or Group costs and sum total, depending on how you want the data to be displayed in the grid.
Note: If Individual Costs is selected, each selected action will add a new row to the cost grid. If Group costs and sum total is selected, all selected action costs are summed by year number and inserted into grid as one row.
Select Finish.
The selected cost data is imported to the Cost Data grid.
Select Next.
A list of Production Events appears based on the event, where the causing asset has been associated with either primary or secondary elements.

Beside each Production Event that you want to import, select the check box, and then select Next.
The Data Mapping section appears.

Enter values in the Cost ID, Cost, Date, Start Date, and End Date boxes, and then select Next.
Note: The Date selection in the Data Mapping subsection determines whether repeat events are based on the Start Date or End Date of the source event. The Start Date and End Date fields in the Review Period subsection define the frequency of the repeat events.
Select Individual Costs or Group costs and sum total, depending on how you want the data to be displayed in the grid, and then select Finish.
Note: If Individual Costs is selected, each selected event will add a new row to the cost grid. If Group costs and sum total is selected, all selected event costs are summed by year number and inserted into grid as one row. The Total Cost of a Production event includes Lost Production Cost and Other Event Cost.
The selected cost data is imported to the Cost Data grid and repeated every review period until the end of the analysis with cost inflation applied.
Select Browse.
The Select a Dataset from the catalog window appears.

Select Open.
The dataset link is automatically populated in the Dataset box.
Select Next.
Data from the selected dataset is displayed.
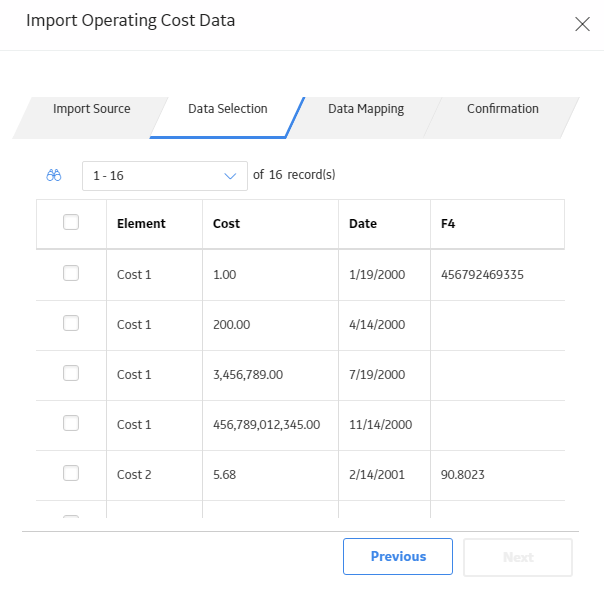
Select the data that you want to insert into the Cost Data grid.
Select Next.
The Data Mapping section appears.
Enter the Cost ID, Cost, Date, Start Date, and End Date values.
Note: The difference between the Date value in each row and the Start Date entered in step 10 will determine the period number of each row. For example, if year number is 5, then the current cost will be populated in the Year 5 column. The Review Period Start Date must precede the date of the first imported cost. The Review Period End Date must follow the date of the most recent imported cost.
Select Next.
A list of the costs that you are importing appears.
Depending on how you want the data to be displayed in the grid, select Individual Costs or Group costs and sum total.
Note: If Individual Costs is selected, each cost will be inserted into the grid as a new row. If Group costs and sum total is selected, all costs will be combined and only one new row will be inserted into the grid.
Select Finish.
The selected cost data is imported to the Cost Data grid and repeated every review period until the end of the analysis with cost inflation applied.
Copyright © 2018 General Electric Company. All rights reserved.