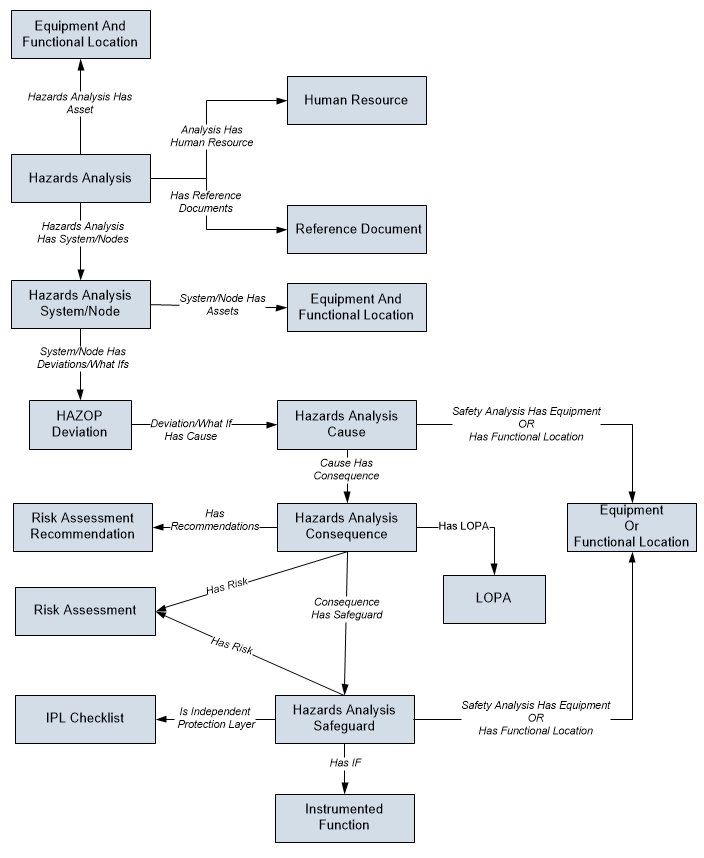
The following diagram shows how the families used in a HAZOP Analysis are related to one another.
The following diagram shows how the families used in a What If Analysis are related to one another.

Note: In the preceding diagrams, boxes represent entity families and arrows represent relationship families that are configured in the baseline database. You can determine the direction of the each relationship definition from the direction of the arrow head: the box from which the arrow originates is the predecessor, and the box to which the arrow head points is the successor.
All HAZOP Analyses and What If Analyses begin with a Hazards Analysis. Each Hazards Analysis is linked to:
Depending on whether you are conducting a HAZOP Analysis or a What If Analysis, each System/Node is linked to:
HAZOP Deviation records (for a HAZOP Analysis).
-or-
Note: The record to which the System/Node is linked is the only difference between the HAZOP Analysis data model and the What If Analysis data model.
Each HAZOP Deviation or What If is linked to one or more Cause records.
Each Cause is linked to:
Each Consequence is linked to:
Risk Assessment Recommendation records.
Note: Risk Assessment Recommendations can be linked to Equipment through the Safety Analysis Has Equipment relationship. To simplify the data model images, this relationship is not included in the images.
Each Safeguard can be linked to:
One Instrumented Function record.
Note: Instrumented Functions are also used by SIS Management to store details on the instrumented function for a given safety system.
In addition to the relationships explained previously, families exist that are used by Hazards Analysis to support Revision History. The family caption for these families matches the source family name, appended with Revision to indicate that the family is a Revision family.
Copyright © 2018 General Electric Company. All rights reserved.